

Answered step by step
Verified Expert Solution
Question
1 Approved Answer
Question person 1 and 2 please ANSWER QUESTION 2 OR QUESTION 3 2. Consider Table 4. Each part of question 2 carry equal marks. (a)
Question person 1 and 2 please
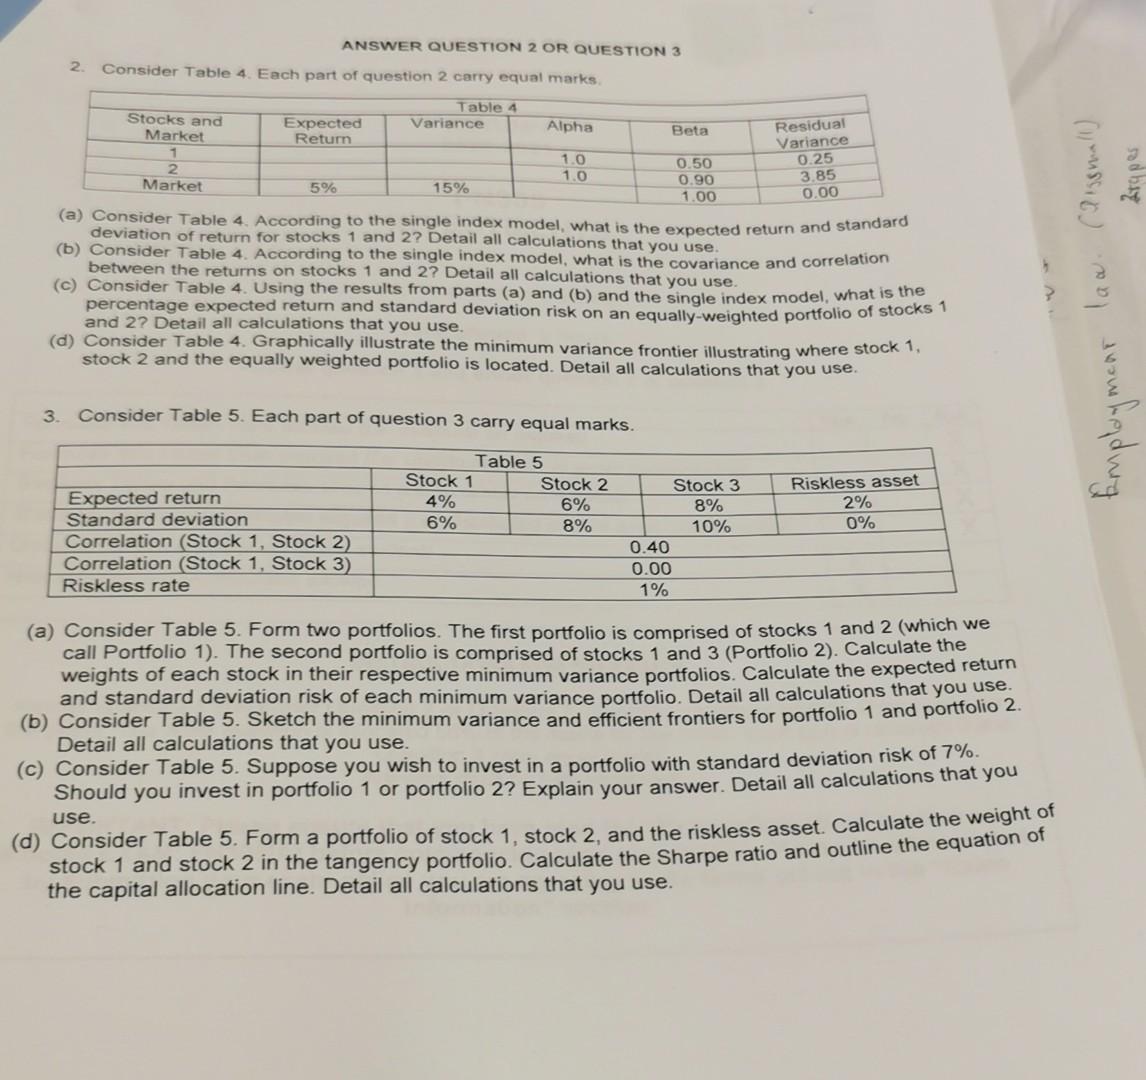
ANSWER QUESTION 2 OR QUESTION 3 2. Consider Table 4. Each part of question 2 carry equal marks. (a) Consider Table 4. According to the single index model, what is the expected return and standard deviation of return for stocks 1 and 2 ? Detail all calculations that you use. (b) Consider Table 4. According to the single index model, what is the covariance and correlation between the returns on stocks 1 and 2 ? Detail all calculations that you use. (c) Consider Table 4. Using the results from parts (a) and (b) and the single index model, what is the percentage expected return and standard deviation risk on an equally-weighted portfolio of stocks 1 and 2? Detail all calculations that you use. (d) Consider Table 4. Graphically illustrate the minimum variance frontier illustrating where stock 1 , stock 2 and the equally weighted portfolio is located. Detail all calculations that you use. 3. Consider Table 5. Each part of question 3 carry equal marks. (a) Consider Table 5. Form two portfolios. The first portfolio is comprised of stocks 1 and 2 (which we call Portfolio 1). The second portfolio is comprised of stocks 1 and 3 (Portfolio 2). Calculate the weights of each stock in their respective minimum variance portfolios. Calculate the expected return and standard deviation risk of each minimum variance portfolio. Detail all calculations that you use. (b) Consider Table 5. Sketch the minimum variance and efficient frontiers for portfolio 1 and portfolio 2. Detail all calculations that you use. (c) Consider Table 5. Suppose you wish to invest in a portfolio with standard deviation risk of 7%. Should you invest in portfolio 1 or portfolio 2? Explain your answer. Detail all calculations that you use. (d) Consider Table 5. Form a portfolio of stock 1, stock 2, and the riskless asset. Calculate the weight of stock 1 and stock 2 in the tangency portfolio. Calculate the Sharpe ratio and outline the equation of the capital allocation line. Detail all calculations that you useStep by Step Solution
There are 3 Steps involved in it
Step: 1

Get Instant Access to Expert-Tailored Solutions
See step-by-step solutions with expert insights and AI powered tools for academic success
Step: 2

Step: 3
Ace Your Homework with AI
Get the answers you need in no time with our AI-driven, step-by-step assistance
Get Started
Capital Failure Rebuilding Trust In Financial Services
Authors: Nicholas Morris , David Vines
1st Edition
0198712227,019102077X