Answered step by step
Verified Expert Solution
Question
1 Approved Answer
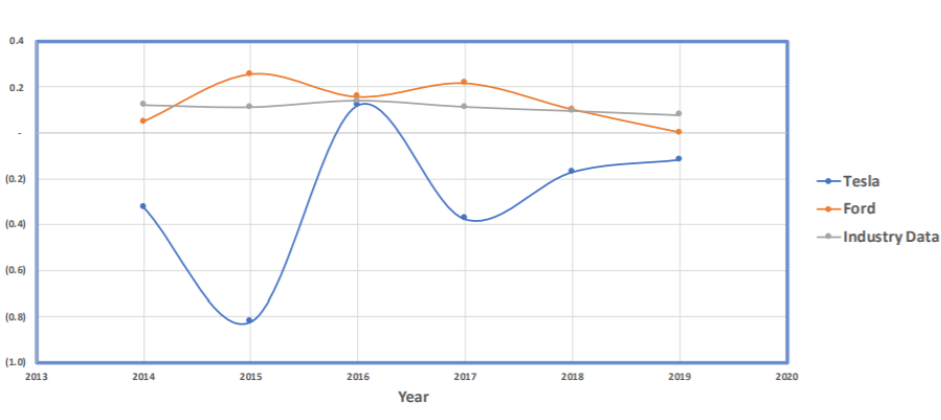
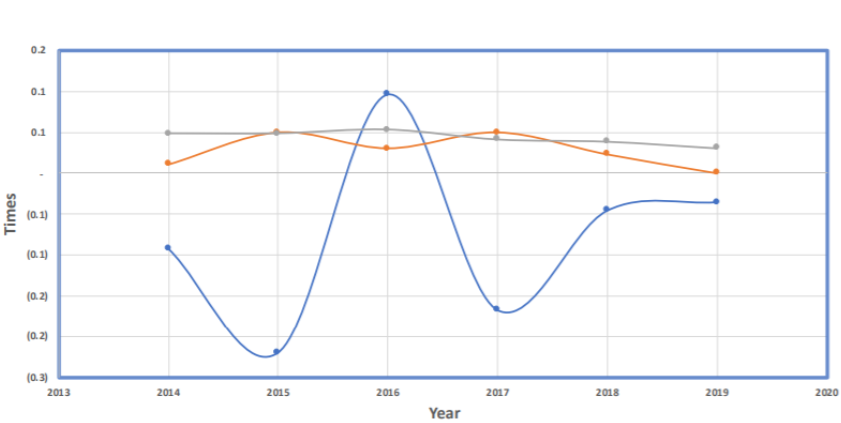
Question Prompt: Analyze the numbers that are on each graph. Recreate each graph in excel using the same numbers and make sure to use different


Question Prompt: Analyze the numbers that are on each graph. Recreate each graph in excel using the same numbers and make sure to use different color coding! The objective includes being able to have input the same points listed on the graph!
0.4 0.2 (0.2) r +Tesla Ford Industry Data (0.4) (0.6) (0.8) (1.0) 2013 2014 2015 2016 2017 2018 2019 2020 Year 0.2 0.1 0.1 Times (0.1) (0.1) (0.2) (0.2) (0.3) 2013 2014 2015 2016 2017 2018 2019 2020 Year 0.4 0.2 (0.2) r +Tesla Ford Industry Data (0.4) (0.6) (0.8) (1.0) 2013 2014 2015 2016 2017 2018 2019 2020 Year 0.2 0.1 0.1 Times (0.1) (0.1) (0.2) (0.2) (0.3) 2013 2014 2015 2016 2017 2018 2019 2020 YearStep by Step Solution
There are 3 Steps involved in it
Step: 1

Get Instant Access to Expert-Tailored Solutions
See step-by-step solutions with expert insights and AI powered tools for academic success
Step: 2

Step: 3

Ace Your Homework with AI
Get the answers you need in no time with our AI-driven, step-by-step assistance
Get Started


