question text. Style requirements [1 point]: This assignment requires the submission of a spreadsheet or a simple script. Please keep THREE decimal places in your
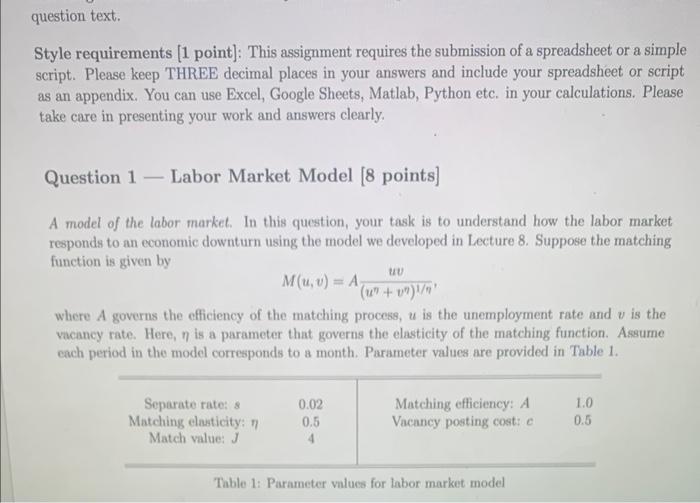
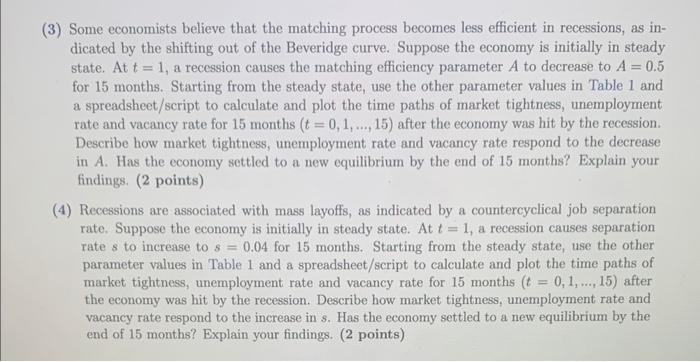
question text. Style requirements [1 point]: This assignment requires the submission of a spreadsheet or a simple script. Please keep THREE decimal places in your answers and include your spreadsheet or script as an appendix. You can use Excel, Google Sheets, Matlab, Python etc. in your calculations. Please take care in presenting your work and answers clearly. Question 1 - Labor Market Model [8 points] A model of the labor market. In this question, your task is to understand how the labor market responds to an economic downturn using the model we developed in Lecture 8. Suppose the matching function is given by M(u, U) = AT (17+ 07)1/1' where A governs the efficiency of the matching process, u is the unemployment rate and v is the vacancy rate. Here, n is a parameter that governs the elasticity of the matching function. Assume each period in the model corresponds to a month. Parameter values are provided in Table 1. Separate rate: s 0.02 Matching efficiency: A 1.0 Matching elasticity: n 0.5 Vacancy posting cost: c 0.5 Match value: J. 4 Table 1: Parameter values for labor market model(3) Some economists believe that the matching process becomes less efficient in recessions, as in- dicated by the shifting out of the Beveridge curve. Suppose the economy is initially in steady state. At t = 1, a recession causes the matching efficiency parameter A to decrease to A = 0.5 for 15 months. Starting from the steady state, use the other parameter values in Table 1 and a spreadsheet/script to calculate and plot the time paths of market tightness, unemployment rate and vacancy rate for 15 months (t = 0, 1, ..., 15) after the economy was hit by the recession. Describe how market tightness, unemployment rate and vacancy rate respond to the decrease in A. Has the economy settled to a new equilibrium by the end of 15 months? Explain your findings. (2 points) (4) Recessions are associated with mass layoffs, as indicated by a countercyclical job separation rate. Suppose the economy is initially in steady state. At { = 1, a recession causes separation rate s to increase to s = 0.04 for 15 months. Starting from the steady state, use the other parameter values in Table 1 and a spreadsheet/script to calculate and plot the time paths of market tightness, unemployment rate and vacancy rate for 15 months (t = 0, 1, ., 15) after the economy was hit by the recession. Describe how market tightness, unemployment rate and vacancy rate respond to the increase in s. Has the economy settled to a new equilibrium by the end of 15 months? Explain your findings. (2 points)
Step by Step Solution
There are 3 Steps involved in it
Step: 1
Get Instant Access to Expert-Tailored Solutions
See step-by-step solutions with expert insights and AI powered tools for academic success
Step: 2
Step: 3
Ace Your Homework with AI
Get the answers you need in no time with our AI-driven, step-by-step assistance