Answered step by step
Verified Expert Solution
Question
1 Approved Answer
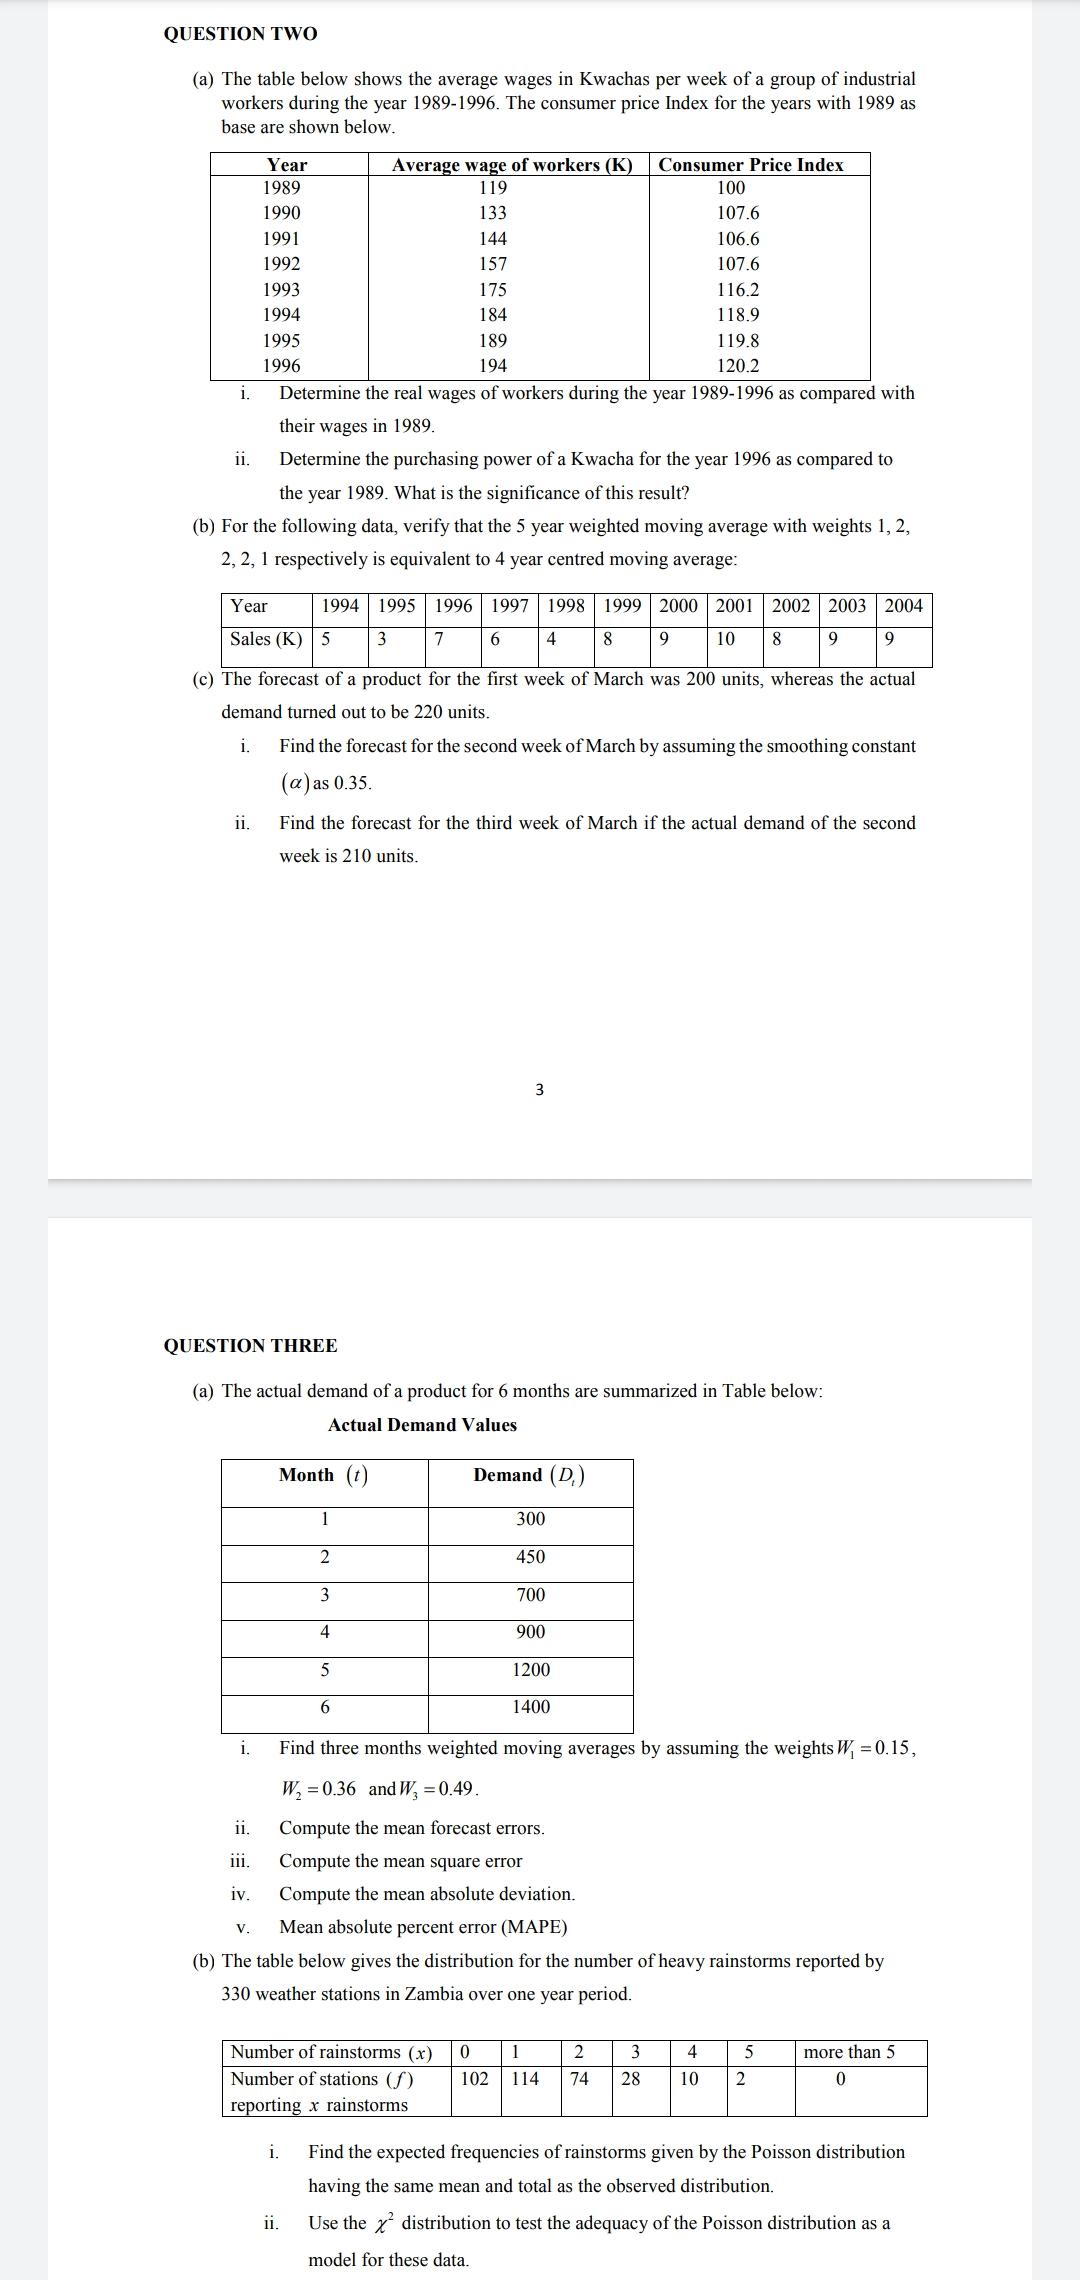
QUESTION TWO (a) The table below shows the average wages in Kwachas per week of a group of industrial workers during the year 1989-1996.

QUESTION TWO (a) The table below shows the average wages in Kwachas per week of a group of industrial workers during the year 1989-1996. The consumer price Index for the years with 1989 as base are shown below. i. ii. Average wage of workers (K) Consumer Price Index 119 100 107.6 133 144 106.6 157 107.6 175 116.2 184 118.9 189 119.8 194 120.2 Determine the real wages of workers during the year 1989-1996 as compared with their wages in 1989. Determine the purchasing power of a Kwacha for the year 1996 as compared to the year 1989. What is the significance of this result? (b) For the following data, verify that the 5 year weighted moving average with weights 1, 2, 2, 2, 1 respectively is equivalent to 4 year centred moving average: Year 1989 1990 1991 ii. 1992 1993 1994 1995 1996 Year 1994 1995 1996 1997 Sales (K) 5 3 7 6 (c) The forecast of a product for the first week of March was 200 units, whereas the actual demand turned out to be 220 units. i. Find the forecast for the second week of March by assuming the smoothing constant (a) as 0.35. Find the forecast for the third week of March if the actual demand of the second week is 210 units. i. QUESTION THREE (a) The actual demand of a product for 6 months are summarized in Table below: Actual Demand Values Demand (D) Month (1) 1 2 3 4 5 3 6 i. 300 450 700 1998 1999 2000 2001 2002 2003 2004 9 10 8 9 4 8 9 900 1200 Find three months weighted moving averages by assuming the weights W = 0.15, W = 0.36 and W = 0.49. ii. Compute the mean forecast errors. iii. Compute the mean square error iv. Compute the mean absolute deviation. V. Mean absolute percent error (MAPE) (b) The table below gives the distribution for the number of heavy rainstorms reported by 330 weather stations in Zambia over one year period. 1400 Number of rainstorms (x) 0 1 Number of stations (f) 102 114 reporting x rainstorms 2 3 74 28 4 5 10 2 more than 5 0 Find the expected frequencies of rainstorms given by the Poisson distribution having the same mean and total as the observed distribution. ii. Use the distribution to test the adequacy of the Poisson distribution as a model for these data.
Step by Step Solution
★★★★★
3.43 Rating (169 Votes )
There are 3 Steps involved in it
Step: 1
QUESTION TWO a idetermine real wages of workers during the years 19891996 as compared with their wages in 1989 year Average wage of workers K Consumer price index Real wages 1989 119 100 119 1990 133 ...
Get Instant Access to Expert-Tailored Solutions
See step-by-step solutions with expert insights and AI powered tools for academic success
Step: 2

Step: 3

Ace Your Homework with AI
Get the answers you need in no time with our AI-driven, step-by-step assistance
Get Started


