QUESTION:
Using the information below for company A, what is the fixed asset turnover ratio, account receivable ration and average payment period for 2018
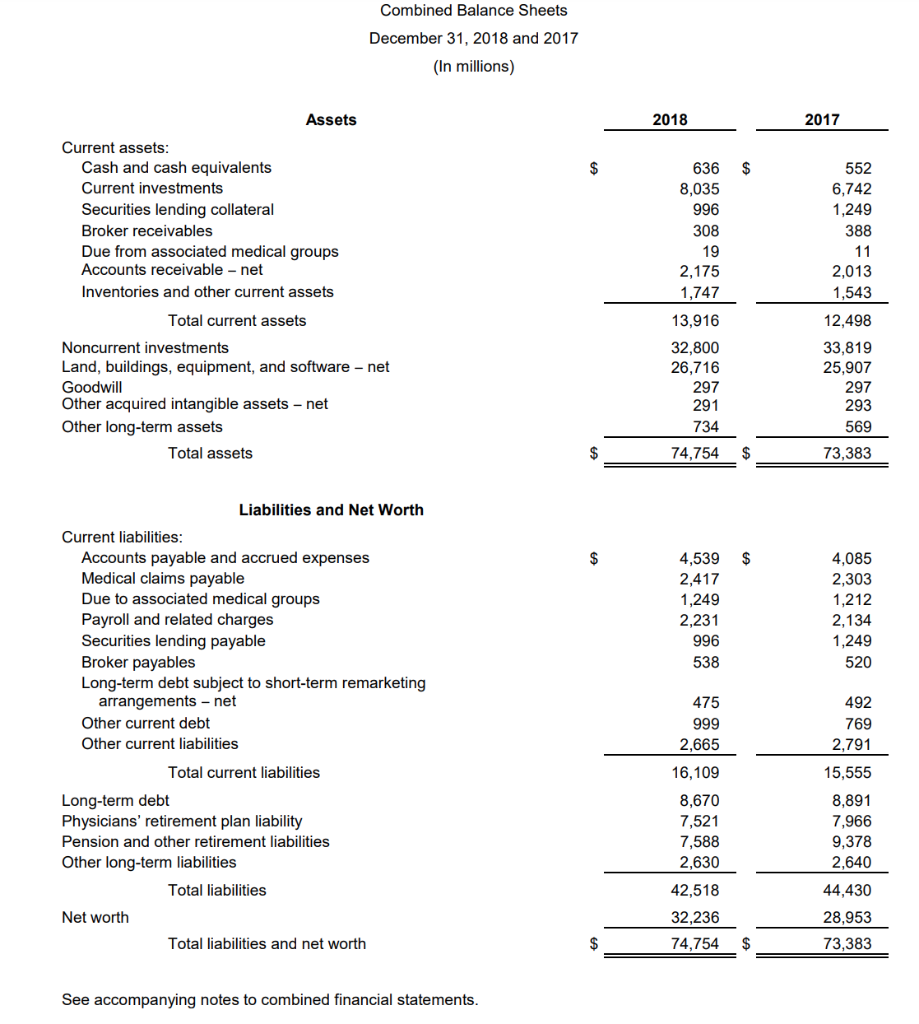
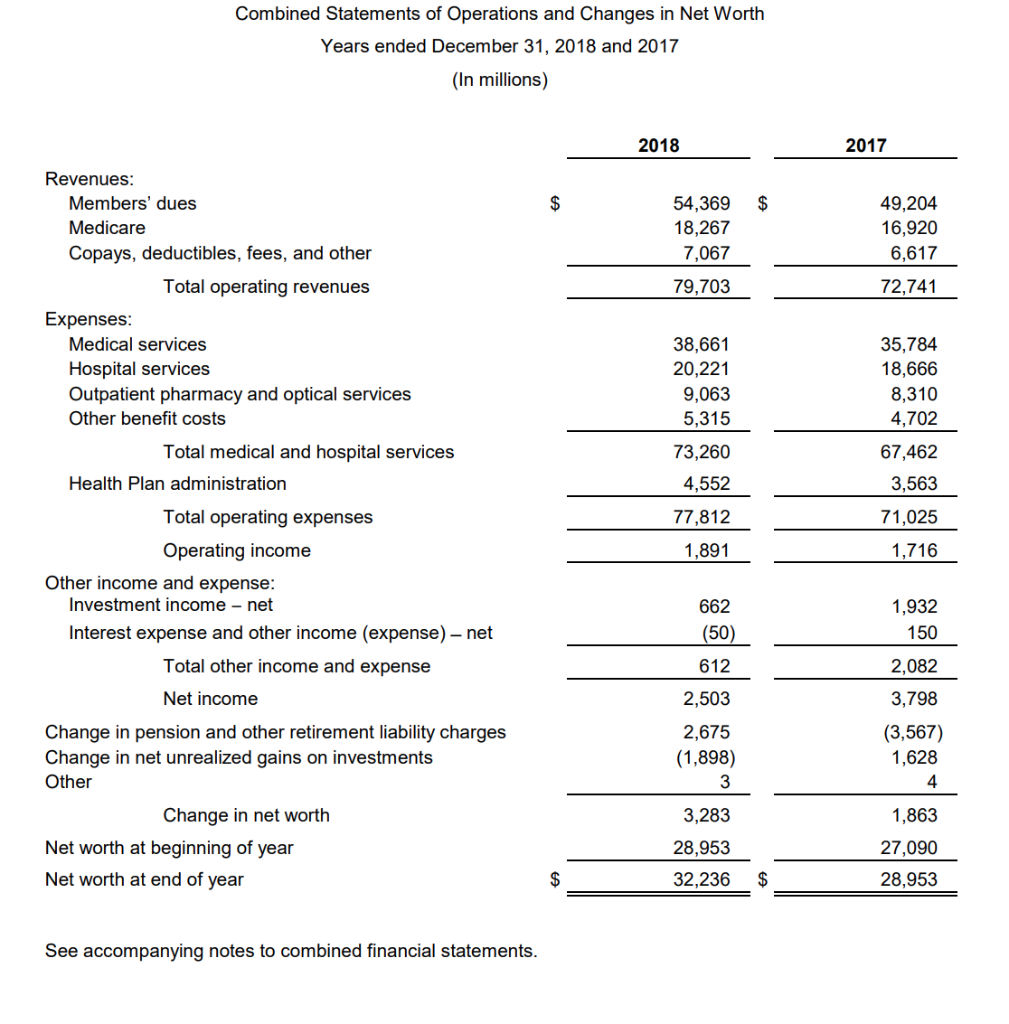
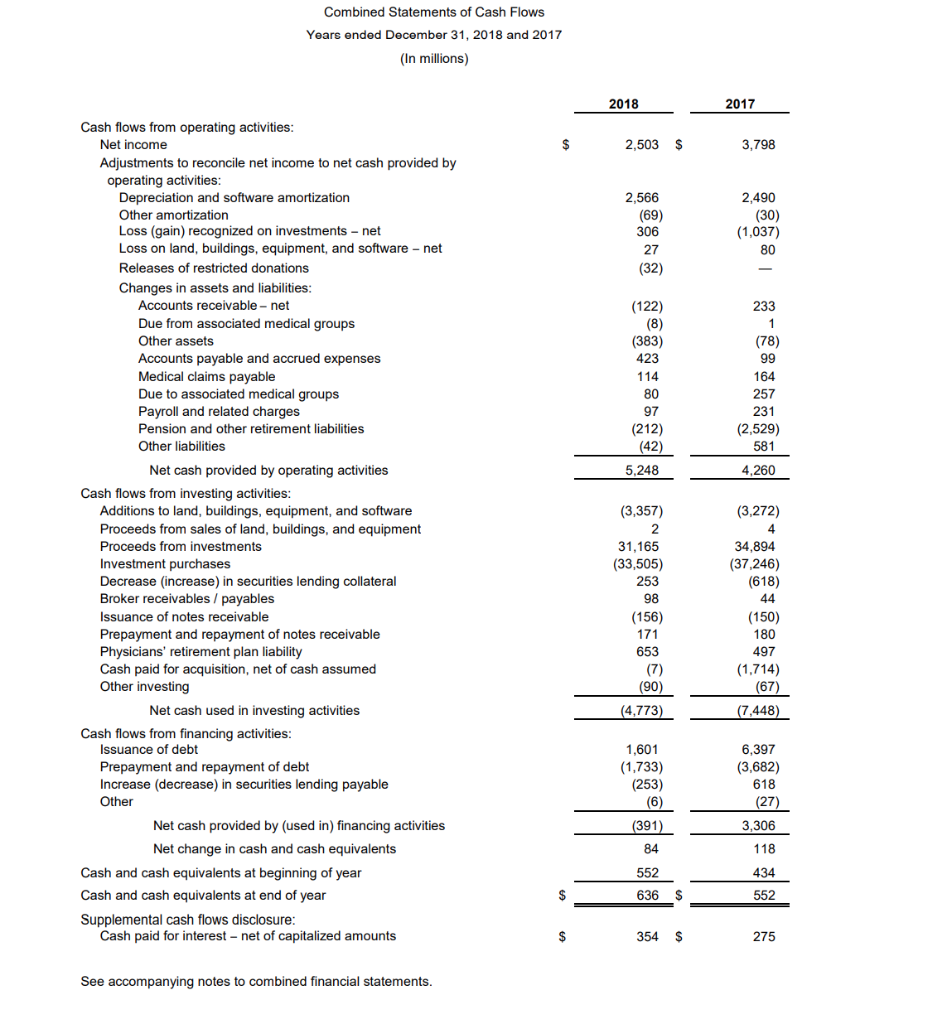
Combined Balance Sheets December 31, 2018 and 2017 (In millions) 2018 2017 $ $ 636 8,035 996 308 552 6,742 1,249 388 19 Assets Current assets: Cash and cash equivalents Current investments Securities lending collateral Broker receivables Due from associated medical groups Accounts receivable - net Inventories and other current assets Total current assets Noncurrent investments Land, buildings, equipment, and software - net Goodwill Other acquired intangible assets - net Other long-term assets Total assets 2,175 1,747 13,916 32,800 26,716 297 291 734 74,754 2,013 1,543 12,498 33,819 25,907 297 293 569 $ $ 73,383 $ 4,539 2,417 1,249 2,231 996 538 4,085 2,303 1,212 2,134 1,249 520 475 Liabilities and Net Worth Current liabilities: Accounts payable and accrued expenses Medical claims payable Due to associated medical groups Payroll and related charges Securities lending payable Broker payables Long-term debt subject to short-term remarketing arrangements - net Other current debt Other current liabilities Total current liabilities Long-term debt Physicians' retirement plan liability Pension and other retirement liabilities Other long-term liabilities Total liabilities Net worth Total liabilities and net worth 999 2,665 492 769 2,791 16,109 8,670 7,521 7,588 2,630 15,555 8,891 7,966 9,378 2,640 42,518 32,236 74,754 44,430 28,953 73,383 $ See accompanying notes to combined financial statements. Combined Statements of Operations and Changes in Net Worth Years ended December 31, 2018 and 2017 (In millions) 2018 2017 $ 54,369 18,267 7,067 79,703 49,204 16,920 6,617 72,741 35,784 18,666 8,310 4,702 38,661 20,221 9,063 5,315 73,260 4,552 77,812 67,462 3,563 71,025 Revenues: Members' dues Medicare Copays, deductibles, fees, and other Total operating revenues Expenses: Medical services Hospital services Outpatient pharmacy and optical services Other benefit costs Total medical and hospital services Health Plan administration Total operating expenses Operating income Other income and expense: Investment income-net Interest expense and other income (expense) - net Total other income and expense Net income Change in pension and other retirement liability charges Change in net unrealized gains on investments Other Change in net worth Net worth at beginning of year Net worth at end of year 1,891 1,716 662 (50) 612 2,503 2,675 (1,898) 1,932 150 2,082 3,798 (3,567) 1,628 4 3 3,283 28,953 32,236 1,863 27,090 28,953 $ $ See accompanying notes to combined financial statements. Combined Statements of Cash Flows Years ended December 31, 2018 and 2017 (In millions) 2018 2017 2,503 $ 3,798 2,566 (69) 306 2,490 (30) (1,037) 80 (32) 233 (122) (8) (383) 423 114 80 97 (78) 99 164 257 231 (2,529) 581 4,260 (212) (42) 5,248 (3,357) (3,272) Cash flows from operating activities: Net income Adjustments to reconcile net income to net cash provided by operating activities: Depreciation and software amortization Other amortization Loss (gain) recognized on investments - net Loss on land, buildings, equipment, and software - net Releases of restricted donations Changes in assets and liabilities: Accounts receivable - net Due from associated medical groups Other assets Accounts payable and accrued expenses Medical claims payable Due to associated medical groups Payroll and related charges Pension and other retirement liabilities Other liabilities Net cash provided by operating activities Cash flows from investing activities: Additions to land, buildings, equipment, and software Proceeds from sales of land, buildings, and equipment Proceeds from investments Investment purchases Decrease increase) in securities lending collateral Broker receivables / payables Issuance of notes receivable Prepayment and repayment of notes receivable Physicians' retirement plan liability Cash paid for acquisition, net of cash assumed Other investing Net cash used in investing activities Cash flows from financing activities: Issuance of debt Prepayment and repayment of debt Increase (decrease) in securities lending payable Other Net cash provided by (used in) financing activities Net change in cash and cash equivalents Cash and cash equivalents at beginning of year Cash and cash equivalents at end of year Supplemental cash flows disclosure: Cash paid for interest - net of capitalized amounts 2 31,165 (33,505) 34,894 (37,246) (618) 44 253 98 (156) (150) 171 653 180 497 (1,714) (67) (90) (4,773) (7,448) 1,601 (1,733) (253) (6) 6,397 (3,682) 618 (27) 3,306 (391) 84 118 434 552 636 $ 552 $ 354 $ 275 See accompanying notes to combined financial statements. Combined Balance Sheets December 31, 2018 and 2017 (In millions) 2018 2017 $ $ 636 8,035 996 308 552 6,742 1,249 388 19 Assets Current assets: Cash and cash equivalents Current investments Securities lending collateral Broker receivables Due from associated medical groups Accounts receivable - net Inventories and other current assets Total current assets Noncurrent investments Land, buildings, equipment, and software - net Goodwill Other acquired intangible assets - net Other long-term assets Total assets 2,175 1,747 13,916 32,800 26,716 297 291 734 74,754 2,013 1,543 12,498 33,819 25,907 297 293 569 $ $ 73,383 $ 4,539 2,417 1,249 2,231 996 538 4,085 2,303 1,212 2,134 1,249 520 475 Liabilities and Net Worth Current liabilities: Accounts payable and accrued expenses Medical claims payable Due to associated medical groups Payroll and related charges Securities lending payable Broker payables Long-term debt subject to short-term remarketing arrangements - net Other current debt Other current liabilities Total current liabilities Long-term debt Physicians' retirement plan liability Pension and other retirement liabilities Other long-term liabilities Total liabilities Net worth Total liabilities and net worth 999 2,665 492 769 2,791 16,109 8,670 7,521 7,588 2,630 15,555 8,891 7,966 9,378 2,640 42,518 32,236 74,754 44,430 28,953 73,383 $ See accompanying notes to combined financial statements. Combined Statements of Operations and Changes in Net Worth Years ended December 31, 2018 and 2017 (In millions) 2018 2017 $ 54,369 18,267 7,067 79,703 49,204 16,920 6,617 72,741 35,784 18,666 8,310 4,702 38,661 20,221 9,063 5,315 73,260 4,552 77,812 67,462 3,563 71,025 Revenues: Members' dues Medicare Copays, deductibles, fees, and other Total operating revenues Expenses: Medical services Hospital services Outpatient pharmacy and optical services Other benefit costs Total medical and hospital services Health Plan administration Total operating expenses Operating income Other income and expense: Investment income-net Interest expense and other income (expense) - net Total other income and expense Net income Change in pension and other retirement liability charges Change in net unrealized gains on investments Other Change in net worth Net worth at beginning of year Net worth at end of year 1,891 1,716 662 (50) 612 2,503 2,675 (1,898) 1,932 150 2,082 3,798 (3,567) 1,628 4 3 3,283 28,953 32,236 1,863 27,090 28,953 $ $ See accompanying notes to combined financial statements. Combined Statements of Cash Flows Years ended December 31, 2018 and 2017 (In millions) 2018 2017 2,503 $ 3,798 2,566 (69) 306 2,490 (30) (1,037) 80 (32) 233 (122) (8) (383) 423 114 80 97 (78) 99 164 257 231 (2,529) 581 4,260 (212) (42) 5,248 (3,357) (3,272) Cash flows from operating activities: Net income Adjustments to reconcile net income to net cash provided by operating activities: Depreciation and software amortization Other amortization Loss (gain) recognized on investments - net Loss on land, buildings, equipment, and software - net Releases of restricted donations Changes in assets and liabilities: Accounts receivable - net Due from associated medical groups Other assets Accounts payable and accrued expenses Medical claims payable Due to associated medical groups Payroll and related charges Pension and other retirement liabilities Other liabilities Net cash provided by operating activities Cash flows from investing activities: Additions to land, buildings, equipment, and software Proceeds from sales of land, buildings, and equipment Proceeds from investments Investment purchases Decrease increase) in securities lending collateral Broker receivables / payables Issuance of notes receivable Prepayment and repayment of notes receivable Physicians' retirement plan liability Cash paid for acquisition, net of cash assumed Other investing Net cash used in investing activities Cash flows from financing activities: Issuance of debt Prepayment and repayment of debt Increase (decrease) in securities lending payable Other Net cash provided by (used in) financing activities Net change in cash and cash equivalents Cash and cash equivalents at beginning of year Cash and cash equivalents at end of year Supplemental cash flows disclosure: Cash paid for interest - net of capitalized amounts 2 31,165 (33,505) 34,894 (37,246) (618) 44 253 98 (156) (150) 171 653 180 497 (1,714) (67) (90) (4,773) (7,448) 1,601 (1,733) (253) (6) 6,397 (3,682) 618 (27) 3,306 (391) 84 118 434 552 636 $ 552 $ 354 $ 275 See accompanying notes to combined financial statements