

Question: Write a MATLAB script to visualize a 3D plot of a mathematical function, specifically the Ackley's function. Ackley's function is defined as:f(x,y)=?20exp(?0.2 ?sqrt(0.5(x^2+y^2))?exp(0.5cos(2pi x)+cos(2pi
Question: Write a MATLAB script to visualize a 3D plot of a mathematical function, specifically the "Ackley's function." Ackley's function is defined as:f(x,y)=?20exp(?0.2 ?sqrt(0.5(x^2+y^2))?exp(0.5cos(2\pi x)+cos(2\pi y))+e+20Generate a 3D surface plot for Ackley's function using x and y values in the range [?5,5]. ?Include labels for the axes and a title for the
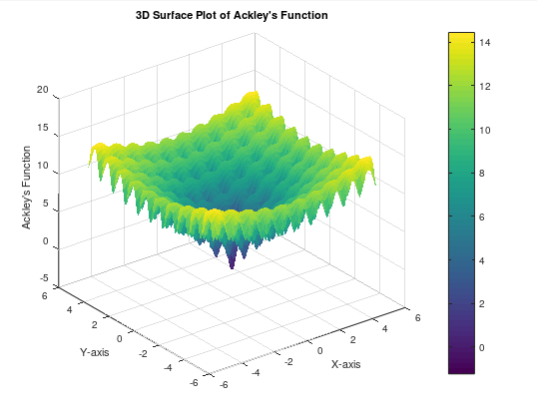
20 20 15 10 Ackley's Function 50 -5 G 4 3D Surface Plot of Ackley's Function 2 Y-axis 2 14 12 10 2 2 0 X-axis
Step by Step Solution
There are 3 Steps involved in it
Step: 1
MATLAB CodeScript Define the Ackleys function ackley x y 20 exp02 s... View full answer

Get step-by-step solutions from verified subject matter experts
100% Satisfaction Guaranteed-or Get a Refund!
Step: 2Unlock detailed examples and clear explanations to master concepts

Step: 3Unlock to practice, ask and learn with real-world examples
See step-by-step solutions with expert insights and AI powered tools for academic success
-
 Access 30 Million+ textbook solutions.
-
Ask unlimited questions from AI Tutors.
-
Order free textbooks.
-
100% Satisfaction Guaranteed-or Get a Refund!
Claim Your Hoodie Now!
Authors: Ferdinand Beer, E. Russell Johnston, Jr., Elliot Eisenberg, William Clausen, David Mazurek, Phillip Cornwell
8th Edition
73212229, 978-0073212227

Study Smart with AI Flashcards
Access a vast library of flashcards, create your own, and experience a game-changing transformation in how you learn and retain knowledge
Explore Flashcards

