QUESTION
You are a financial analyst in the financial planning and analysis department of EMC. You have been assigned the following:
PART 1 Complete a five-year forecast (2021 to 2025) based on the above assumptions.
PART 2 Explain why the dividend payout ratio would be reduced and show the impact on dividends per share comparing 2020 to 2021, which 2021 reflects the lower payout ratio. Based on 2021, explain if EMC is, more or less leveraged than the competitors.
PART 3 Management has indicated that a multiple of 9x EBITDA is reasonable to value the invested capital of the company. Explain if and why shareholder value has been created or reduced as a result of the SRC the acquisition when comparing the 2020 value per share (without the SRC acquisition) to the 2021 value per share (with the SRC acquisition).
Overview:
Environmental Management Corporation (EMC) is a regional waste management and environmental services company serving the tri-state region of Pennsylvania, New Jersey, and Delaware. EMC has been reviewing opportunities to expand out of its current geographical region. The corporate development department identified an opportunity, Southern Removal Corp. (SRC), a privately owned company in the niche markets of Columbia, SC and Charlotte, NC that has had some operating issues and is over-leveraged. EMC has decided to move forward with an acquisition transaction and purchase the operating assets of SRC for $185 million.
Forecast
A capital project analysis was completed which determined that EMC should move ahead with the acquisition as it has a positive NPV and IRR above EMCs required rate of return. Management now wants to understand the impact on EMCs financial statements going forward and how the acquisition will impact the income statement, balance sheet and debt level.
EMCs finance, corporate development and operations departments have developed the following five-year forecast assumptions for EMC which considers both its current operations and the addition of the SRCs operations. I
ncome Statement
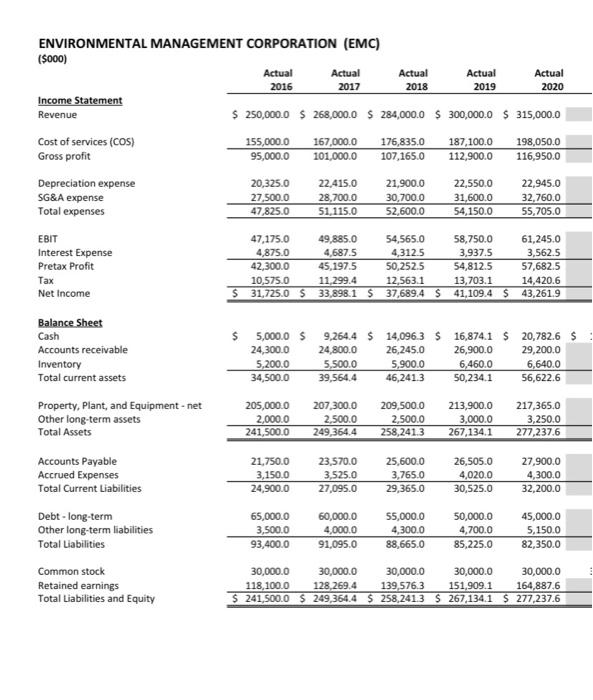
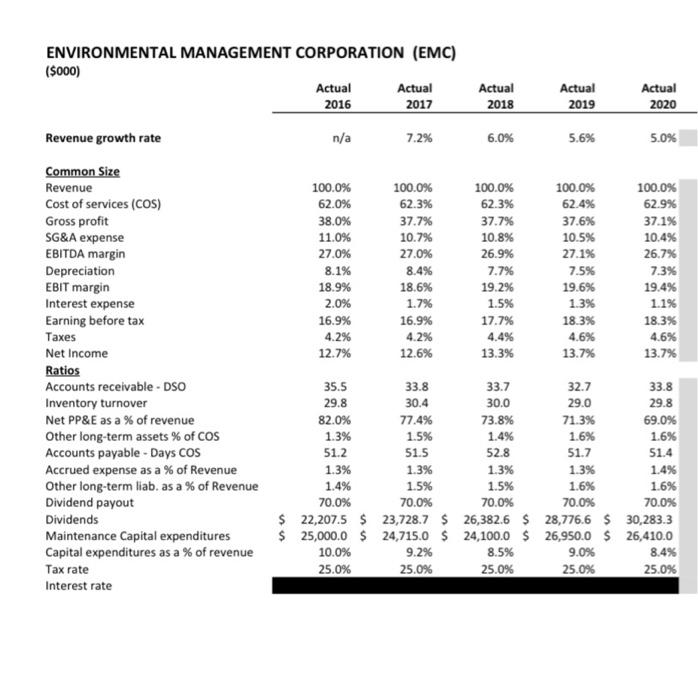
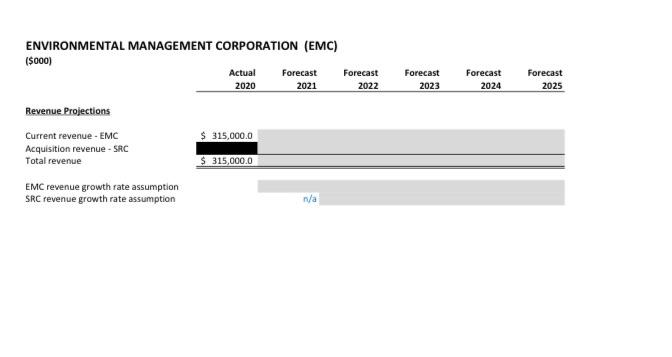
2020 EMC revenue will increase at an annual rate of 4.0%
The SRC acquisition will add $60.0 million of incremental revenue in 2021 and it will increase at an annual rate of 5.0% thereafter
Cost of services will be 62.0% of revenue
SG&A expense will be 9.6% of revenue
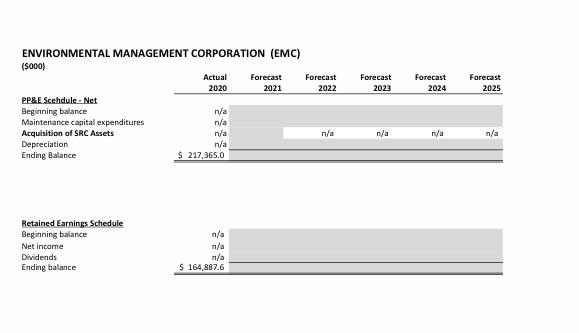
Depreciation expense will be 7.0% of revenue
Interest expense will be based on the average debt outstanding and an interest rate of 7.0%
Tax rate of 25.0%
Balance Sheet
Constant operating cash level of $10.0 million
Accounts receivable DSO of 32 days
Inventory turnover of 29x (inventory consists of recyclable materials resold)
Other long-term assets at 1.5% of cost of services (COS)
Accounts payable days cost of services (COS) of 45 days
Accrued expense 1.5% of revenue
Other long-term liabilities 1.7% of revenue
Dividend payout ratio reduced to 45% from 70% historically
Maintenance capital expenditures of 8.5% of revenue
Acquisition capital expenditures are the cost of the SRC acquisition in 2021 ($185.0 million), no acquisition capx beyond 2021
EMC has 9 million shares outstanding
CLARIFICATION FOR RATE OF GROWTH:
revenue growth rate for:
2016= n/a
2017=7.2%
2018=6.0%
2019=5.6%
2020=5.0%
Information provided on 2020 Revenue Projections:
Current revenue - EMC = 315,00.00
Total Revenue - EMC = 315,000.0
EMC growth rate assumption: n/a
SRC growth rate assumption: n/a
Information provided on 2020 PP&E Schedule & Retained Earnings Schedule:
PP&E schedule -Net:
Ending Balance: 217,365.00
Retained earnings schedule:
Ending balance: 164,887.60
ENVIRONMENTAL MANAGEMENT CORPORATION (EMC) (5000) Actual Actual Actual Actual Actual 2016 2017 2018 2019 2020 Income Statement Revenue $ 250,000.0 $ 268,000.0 S 284,000.0 $ 300,000.0 S 315,000.0 Cost of services (COS) 155,000.0 167,000.0 176,835.0 187,100.0 198,050.0 Gross profit 95,000.0 101,000.0 107,165.0 112,900.0 116,950.0 Depreciation expense SG&A expense Total expenses 20,325.0 27,500.0 47,825.0 22.415.0 28,700.0 51.115.0 21,900.0 30,700.0 52,600.0 22,550.0 31,600.0 54,150.0 22,945.0 32,760.0 55,705.0 EBIT Interest Expense Pretax Profit Tax Net Income 47,175.0 49,885.0 54,565.0 58,750.0 61,245.0 4,875.0 4,687.5 4,312.5 3,937.5 3,562.5 42,300.0 45,197.5 50,252.5 54,812.5 57,682.5 10,575.0 11,299.4 12,563.1 13,703.1 14,420.6 $ 31,725.0 S 33,898.1 $ 37,689.4 S 41.109.4 S 43,261.9 $ Balance Sheet Cash Accounts receivable Inventory Total current assets Property, Plant, and Equipment - net Other long-term assets Total Assets 5,000.0 24,300.0 5,200.0 34,500.0 9,264.4 $ 14,096.3 $ 16,874.1 $ 20,782.6 $ 24,800.0 26,245.0 26,900.0 29,200.0 5,500.0 5,900.0 6,460.0 6,640.0 39,564.4 46,241.3 50,234.1 56,622.6 205,000.0 2,000.0 241,500.0 207,300.0 2,500.0 249,364.4 209,500.0 2,500.0 258,241.3 213,900.0 3,000.0 267,134.1 217,365.0 3,250.0 277,237.6 Accounts Payable Accrued Expenses Total Current Liabilities 21,750.0 3,150.0 24,900.0 23,570.0 3,525.0 27,095.0 25,600.0 3,765.0 29,365.0 26,505.0 4,020.0 30,525.0 27,900.0 4,300.0 32,200.0 65,000.0 3,500.0 93,400.0 60,000.0 4,000.0 91,095.0 55,000.0 4,300.0 88,665.0 50,000.0 4,700.0 85,225.0 45,000.0 5,150.0 82,350.0 Debt - long-term Other long-term liabilities Total Liabilities Common stock Retained earnings Total Liabilities and Equity 30,000.0 30,000.0 30,000.0 30,000.0 30,000.0 118,100.0 128,269.4 139,576.3 151,909.1 164,887,6 $ 241,500.0 $ 249,364.4 $ 258,2413 S 267,134.1 $ 277,237.6 ENVIRONMENTAL MANAGEMENT CORPORATION (EMC) (5000) Actual Actual 2016 2017 Actual 2018 Actual 2019 Actual 2020 Revenue growth rate n/a 7.2% 6.0% 5.6% 5.0% 100.0% 62.0% 38.0% 11.0% 27.0% 8.1% 18.9% 2.0% 16.9% 4.2% 12.7% 100.0% 62.3% 37.7% 10.7% 27.0% 8.4% 18.6% 1.7% 16.9% 4.2% 12.6% 100.0% 62.3% 37.7% 10.8% 26.9% 7.7% 19.2% 1.5% 17.7% 4.4% 13.3% 100.0% 62.4% 37.6% 10.5% 27.1% 7.5% 19.6% 1.3% 18.3% 4.6% 13.7% 100.0% 62.9% 37.1% 10.4% 26.7% 7.3% 19.4% 1.1% 18.3% 4.6% 13.7% Common Size Revenue Cost of services (COS) Gross profit SG&A expense EBITDA margin Depreciation EBIT margin Interest expense Earning before tax Taxes Net Income Ratios Accounts receivable - DSO Inventory turnover Net PP&E as a % of revenue Other long-term assets % of COS Accounts payable - Days Cos Accrued expense as a % of Revenue Other long-term liab. as a % of Revenue Dividend payout Dividends Maintenance Capital expenditures Capital expenditures as a % of revenue Tax rate Interest rate 35.5 33.8 33.7 32.7 33.8 29.8 30.4 30.0 29.0 29.8 82.0% 77.4% 73.8% 71.3% 69.0% 1.3% 1.5% 1.4% 1.6% 1.6% 51.2 51.5 52.8 51.7 51.4 1.3% 1.3% 1.3% 1.3% 1.4% 1.4% 1.5% 1.5% 1.6% 1.6% 70.0% 70.0% 70.0% 70.0% 70.0% $ 22,207.5 $ 23,728.7 $ 26,382.6 $ 28,776.6 $ 30,283.3 $ 25,000.0 $ 24,715.0 $ 24,100,0 $ 26,950.0 $ 26,410.0 10.0% 9.2% 8.5% 9.0% 8.4% 25.0% 25.0% 25.0% 25.0% 25.0% ENVIRONMENTAL MANAGEMENT CORPORATION (EMC) (5000) Actual Forecast Forecast 2022 Forecast 2023 Forecast 2024 Forecast 2025 2020 2021 Revenue Projections $ 315,000.0 Current revenue - EMC Acquisition revenue - SRC Total revenue 315,000.0 EMC revenue growth rate assumption SRC revenue growth rate assumption n/a Forecast 2022 Forecast 2023 Forecast 2024 Forecast 2025 ENVIRONMENTAL MANAGEMENT CORPORATION (EMC) (5000) Actual Forecast 2020 2021 PP&E Scehdule - Net Beginning balance n/a Maintenance capital expenditures n/a Acquisition of SRC Assets n/a Depreciation n/a Ending Balance $ 217,365.0 n/a n/a n/a n/a n/a Retained Earnings Schedule Beginning balance Net income Dividends Ending balance n/a n/a $ 164,887.6 ENVIRONMENTAL MANAGEMENT CORPORATION (EMC) (5000) Actual Actual Actual Actual Actual 2016 2017 2018 2019 2020 Income Statement Revenue $ 250,000.0 $ 268,000.0 S 284,000.0 $ 300,000.0 S 315,000.0 Cost of services (COS) 155,000.0 167,000.0 176,835.0 187,100.0 198,050.0 Gross profit 95,000.0 101,000.0 107,165.0 112,900.0 116,950.0 Depreciation expense SG&A expense Total expenses 20,325.0 27,500.0 47,825.0 22.415.0 28,700.0 51.115.0 21,900.0 30,700.0 52,600.0 22,550.0 31,600.0 54,150.0 22,945.0 32,760.0 55,705.0 EBIT Interest Expense Pretax Profit Tax Net Income 47,175.0 49,885.0 54,565.0 58,750.0 61,245.0 4,875.0 4,687.5 4,312.5 3,937.5 3,562.5 42,300.0 45,197.5 50,252.5 54,812.5 57,682.5 10,575.0 11,299.4 12,563.1 13,703.1 14,420.6 $ 31,725.0 S 33,898.1 $ 37,689.4 S 41.109.4 S 43,261.9 $ Balance Sheet Cash Accounts receivable Inventory Total current assets Property, Plant, and Equipment - net Other long-term assets Total Assets 5,000.0 24,300.0 5,200.0 34,500.0 9,264.4 $ 14,096.3 $ 16,874.1 $ 20,782.6 $ 24,800.0 26,245.0 26,900.0 29,200.0 5,500.0 5,900.0 6,460.0 6,640.0 39,564.4 46,241.3 50,234.1 56,622.6 205,000.0 2,000.0 241,500.0 207,300.0 2,500.0 249,364.4 209,500.0 2,500.0 258,241.3 213,900.0 3,000.0 267,134.1 217,365.0 3,250.0 277,237.6 Accounts Payable Accrued Expenses Total Current Liabilities 21,750.0 3,150.0 24,900.0 23,570.0 3,525.0 27,095.0 25,600.0 3,765.0 29,365.0 26,505.0 4,020.0 30,525.0 27,900.0 4,300.0 32,200.0 65,000.0 3,500.0 93,400.0 60,000.0 4,000.0 91,095.0 55,000.0 4,300.0 88,665.0 50,000.0 4,700.0 85,225.0 45,000.0 5,150.0 82,350.0 Debt - long-term Other long-term liabilities Total Liabilities Common stock Retained earnings Total Liabilities and Equity 30,000.0 30,000.0 30,000.0 30,000.0 30,000.0 118,100.0 128,269.4 139,576.3 151,909.1 164,887,6 $ 241,500.0 $ 249,364.4 $ 258,2413 S 267,134.1 $ 277,237.6 ENVIRONMENTAL MANAGEMENT CORPORATION (EMC) (5000) Actual Actual 2016 2017 Actual 2018 Actual 2019 Actual 2020 Revenue growth rate n/a 7.2% 6.0% 5.6% 5.0% 100.0% 62.0% 38.0% 11.0% 27.0% 8.1% 18.9% 2.0% 16.9% 4.2% 12.7% 100.0% 62.3% 37.7% 10.7% 27.0% 8.4% 18.6% 1.7% 16.9% 4.2% 12.6% 100.0% 62.3% 37.7% 10.8% 26.9% 7.7% 19.2% 1.5% 17.7% 4.4% 13.3% 100.0% 62.4% 37.6% 10.5% 27.1% 7.5% 19.6% 1.3% 18.3% 4.6% 13.7% 100.0% 62.9% 37.1% 10.4% 26.7% 7.3% 19.4% 1.1% 18.3% 4.6% 13.7% Common Size Revenue Cost of services (COS) Gross profit SG&A expense EBITDA margin Depreciation EBIT margin Interest expense Earning before tax Taxes Net Income Ratios Accounts receivable - DSO Inventory turnover Net PP&E as a % of revenue Other long-term assets % of COS Accounts payable - Days Cos Accrued expense as a % of Revenue Other long-term liab. as a % of Revenue Dividend payout Dividends Maintenance Capital expenditures Capital expenditures as a % of revenue Tax rate Interest rate 35.5 33.8 33.7 32.7 33.8 29.8 30.4 30.0 29.0 29.8 82.0% 77.4% 73.8% 71.3% 69.0% 1.3% 1.5% 1.4% 1.6% 1.6% 51.2 51.5 52.8 51.7 51.4 1.3% 1.3% 1.3% 1.3% 1.4% 1.4% 1.5% 1.5% 1.6% 1.6% 70.0% 70.0% 70.0% 70.0% 70.0% $ 22,207.5 $ 23,728.7 $ 26,382.6 $ 28,776.6 $ 30,283.3 $ 25,000.0 $ 24,715.0 $ 24,100,0 $ 26,950.0 $ 26,410.0 10.0% 9.2% 8.5% 9.0% 8.4% 25.0% 25.0% 25.0% 25.0% 25.0% ENVIRONMENTAL MANAGEMENT CORPORATION (EMC) (5000) Actual Forecast Forecast 2022 Forecast 2023 Forecast 2024 Forecast 2025 2020 2021 Revenue Projections $ 315,000.0 Current revenue - EMC Acquisition revenue - SRC Total revenue 315,000.0 EMC revenue growth rate assumption SRC revenue growth rate assumption n/a Forecast 2022 Forecast 2023 Forecast 2024 Forecast 2025 ENVIRONMENTAL MANAGEMENT CORPORATION (EMC) (5000) Actual Forecast 2020 2021 PP&E Scehdule - Net Beginning balance n/a Maintenance capital expenditures n/a Acquisition of SRC Assets n/a Depreciation n/a Ending Balance $ 217,365.0 n/a n/a n/a n/a n/a Retained Earnings Schedule Beginning balance Net income Dividends Ending balance n/a n/a $ 164,887.6