Answered step by step
Verified Expert Solution
Question
1 Approved Answer
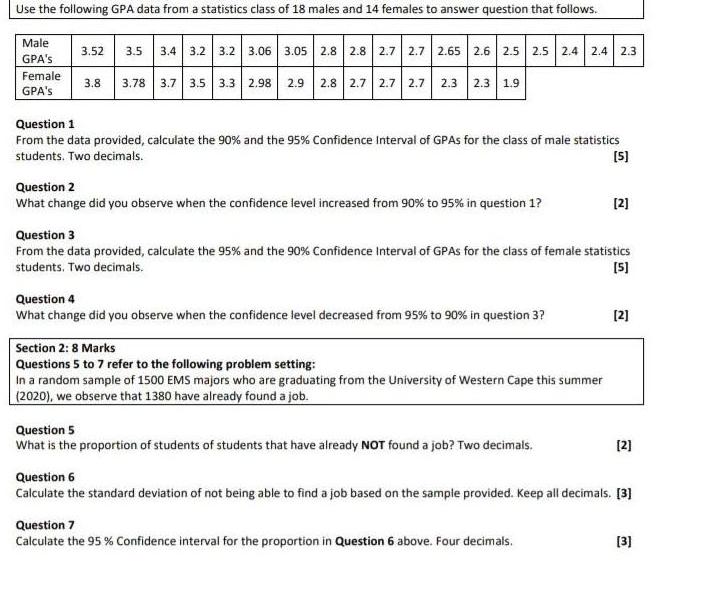
Use the following GPA data from a statistics class of 18 males and 14 females to answer question that follows. Male GPA's Female GPA's


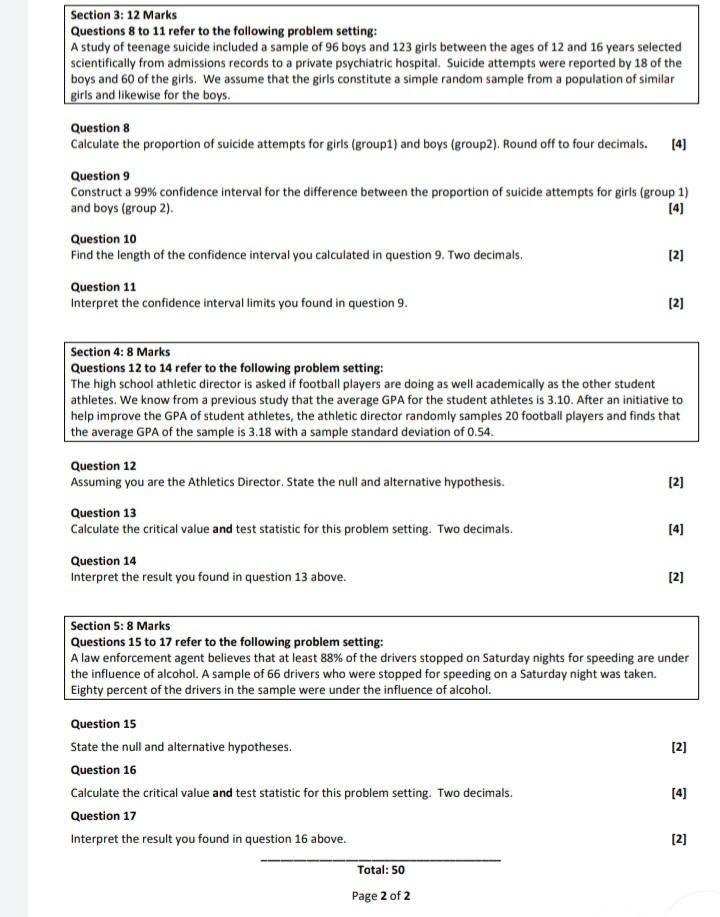
Use the following GPA data from a statistics class of 18 males and 14 females to answer question that follows. Male GPA's Female GPA's 3.52 3.5 3.4 3.2 3.2 3.06 3.05 2.8 2.8 2.7 2.7 2.65 2.6 2.5 2.5 2.4 2.4 2.3 3.8 3.78 3.7 3.5 3.3 2.98 2.9 2.8 2.7 2.7 2.7 2.3 2.3 1.9 Question 1 From the data provided, calculate the 90% and the 95% Confidence Interval of GPAs for the class of male statistics students. Two decimals. [5] Question 2 What change did you observe when the confidence level increased from 90% to 95% in question 1? Question 3 From the data provided, calculate the 95% and the 90% Confidence Interval of GPAs for the class of female statistics students. Two decimals. [5] Question 4 What change did you observe when the confidence level decreased from 95% to 90% in question 3? Section 2:8 Marks Questions 5 to 7 refer to the following problem setting: In a random sample of 1500 EMS majors who are graduating from the University of Western Cape this summer (2020), we observe that 1380 have already found a job. Question 5 What is the proportion of students of students that have already NOT found a job? Two decimals. [2] Question 7 Calculate the 95 % Confidence interval for the proportion in Question 6 above. Four decimals. [2] [2] Question 6 Calculate the standard deviation of not being able to find a job based on the sample provided. Keep all decimals. [3] [3] Section 3: 12 Marks Questions 8 to 11 refer to the following problem setting: A study of teenage suicide included a sample of 96 boys and 123 girls between the ages of 12 and 16 years selected scientifically from admissions records to a private psychiatric hospital. Suicide attempts were reported by 18 of the boys and 60 of the girls. We assume that the girls constitute a simple random sample from a population of similar girls and likewise for the boys. Question 8 Calculate the proportion of suicide attempts for girls (group1) and boys (group2). Round off to four decimals. [4] Question 9 [4] Construct a 99% confidence interval for the difference between the proportion of suicide attempts for girls (group 1) and boys (group 2). Question 10 Find the length of the confidence interval you calculated in question 9. Two decimals. Question 11 Interpret the confidence interval limits you found in question 9. Question 12 Assuming you are the Athletics Director. State the null and alternative hypothesis. Section 4: 8 Marks Questions 12 to 14 refer to the following problem setting: The high school athletic director is asked if football players are doing as well academically as the other student athletes. We know from a previous study that the average GPA for the student athletes is 3.10. After an initiative to help improve the GPA of student athletes, the athletic director randomly samples 20 football players and finds that the average GPA of the sample is 3.18 with a sample standard deviation of 0.54. Question 13 Calculate the critical value and test statistic for this problem setting. Two decimals. Question 14 Interpret the result you found in question 13 above. Question 15 State the null and alternative hypotheses. Question 16 [2] Calculate the critical value and test statistic for this problem setting. Two decimals. Question 17 Interpret the result you found in question 16 above. [2] Total: 50 Page 2 of 2 [2] Section 5: 8 Marks Questions 15 to 17 refer to the following problem setting: A law enforcement agent believes that at least 88% of the drivers stopped on Saturday nights for speeding are under the influence of alcohol. A sample of 66 drivers who were stopped for speeding on a Saturday night was taken. Eighty percent of the drivers in the sample were under the influence of alcohol. [4] [2] [2] [4] [2]
Step by Step Solution
★★★★★
3.56 Rating (170 Votes )
There are 3 Steps involved in it
Step: 1
solve...
Get Instant Access to Expert-Tailored Solutions
See step-by-step solutions with expert insights and AI powered tools for academic success
Step: 2

Step: 3

Ace Your Homework with AI
Get the answers you need in no time with our AI-driven, step-by-step assistance
Get Started


