

Question
Questions: 1. What is the difference between activity-based costing and segment profitability analysis? How would you counter the arguments by other managers concerning the most
Questions:
1. What is the difference between activity-based costing and segment profitability analysis? How would you counter the arguments by other managers concerning the most attractive segments? Using relevant costs provided above, determine the profitability for each of Best Potato Chips' business segments.
2. Based on your analysis, should Best Potato Chips consider the changes desired by Value Savings Stores? Why or why not?
3. Should Best Potato Chips eliminate any business segments?
4. If the price to mass merchandise stores were to increase by 20 percent, would that change your answer to the previous question?
5. Are there factors other than segment profitability that should be considered? If so, what are they?
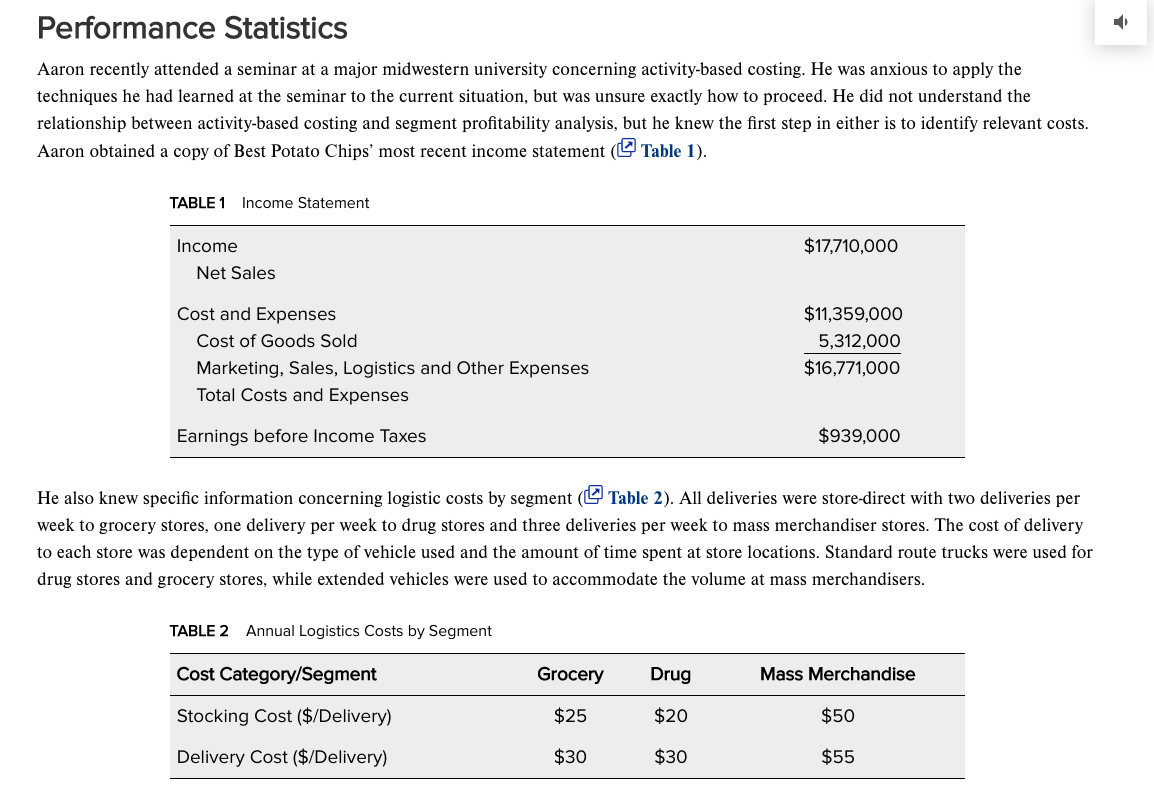
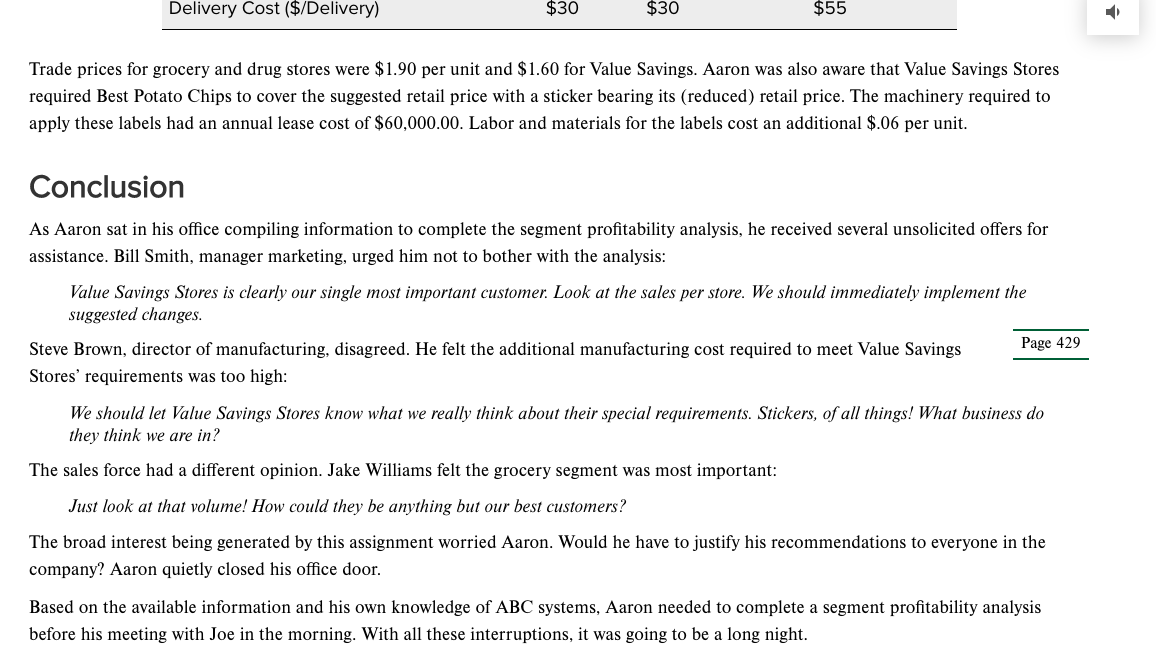
Profitability Analysis at Best Potato Chips, Inc. Aaron Delaney, logistics manager at Best Potato Chips, Inc.., was faced with a difficult task. Joe Kik, the new vice president, had circulated a letter from Best Potato Chips' only mass merchandise customer, Value Savings Stores, complaining of poor operating performance. Among the problems cited by Value Savings Stores were: (1) frequent stockouts on store shelves (2) poor customer service responsiveness and (3) high prices for Best Potato Chips' products. The letter suggested that if Best Potato Chips were to remain a supplier to Value Savings Stores, it would need to eliminate stockouts by: (1) providing direct store delivery four times per week (instead of three) (2) installing an automated order inquiry system to increase customer service responsiveness ($600,000 investment) and (3) decreasing product prices paid by Value by 5 percent. While the previous vice president would most certainly have begun implementing the suggested changes, Joe Kik was different. He requested that Aaron prepare a detailed analysis of Best Potato Chips' profitability by segment. He also asked that it be prepared on a spreadsheet to permit some basic analysis. This was something that Aaron had never previously attempted, and it was needed first thing in the morning. Company Background Best Potato Chips, Inc., is the second largest potato chip producer in the mid-Michigan market. The company was founded in 1962 and following an unsuccessful attempt at national expansion has remained primarily a regional operation. The company currently manufactures and distributes several varieties of potato chips to three different types of retail accounts: grocery, drug, and mass merchandise. The largest percentage of business is concentrated in the grocery segment, with 450 retail customer locations accounting for 6,100,000 annual Page 428 unit sales and more than 65 percent of annual revenue. The drug segment comprises 240 customer locations which account for 1,200,000 annual unit sales and about 13 percent of annual revenue. In the mass merchandise segment, Best Potato Chips has one customer (Value Savings) with 36 locations that account for 2,400,000 annual unit sales and almost 22 percent of annual revenue. All distribution is store-direct, with delivery drivers handling returns of outdated material and all shelf placement and merchandising. Recently, Best Potato Chips has actively sought growth in the mass merchandise segment because of the perceived profit potential. However, while the company is acutely aware of overall business profitability, there has never been an analysis on a customer segment basis. Performance Statistics Aaron recently attended a seminar at a major midwestern university concerning activity-based costing. He was anxious to apply the techniques he had learned at the seminar to the current situation, but was unsure exactly how to proceed. He did not understand the relationship between activity-based costing and segment profitability analysis, but he knew the first step in either is to identify relevant costs. Aaron obtained a copy of Best Potato Chips' most recent income statement (@Table 1). TABLE 1 Income Statement Income $17,710,000 Net Sales Cost and Expenses Cost of Goods Sold Marketing, Sales, Logistics and Other Expenses Total Costs and Expenses $11,359,000 5,312,000 $16,771,000 Earnings before Income Taxes $939,000 He also knew specific information concerning logistic costs by segment (Table 2). All deliveries were store-direct with two deliveries per week to grocery stores, one delivery per week to drug stores and three deliveries per week to mass merchandiser stores. The cost of delivery to each store was dependent on the type of vehicle used and the amount of time spent at store locations. Standard route trucks were used for drug stores and grocery stores, while extended vehicles were used to accommodate the volume at mass merchandisers. TABLE 2 Annual Logistics Costs by Segment Cost Category/Segment Grocery Drug Mass Merchandise Stocking Cost ($/Delivery) $25 $20 $50 Delivery Cost ($/Delivery) $30 $30 $55 Delivery Cost ($/Delivery) $30 $30 $55 Trade prices for grocery and drug stores were $ 1.90 per unit and $1.60 for Value Savings. Aaron was also aware that Value Savings Stores required Best Potato Chips to cover the suggested retail price with a sticker bearing its (reduced) retail price. The machinery required to apply these labels had an annual lease cost of $60,000.00. Labor and materials for the labels cost an additional $.06 per unit. Conclusion As Aaron sat in his office compiling information to complete the segment profitability analysis, he received several unsolicited offers for assistance. Bill Smith, manager marketing, urged him not to bother with the analysis: Value Savings Stores is clearly our single most important customer. Look at the sales per store. We should immediately implement the suggested changes. Steve Brown, director of manufacturing, disagreed. He felt the additional manufacturing cost required to meet Value Savings Page 429 Stores' requirements was too high: We should let Value Savings Stores know what we really think about their special requirements. Stickers, of all things! What business do they think we are in? The sales force had a different opinion. Jake Williams felt the grocery segment was most important: Just look at that volume! How could they be anything but our best customers? The broad interest being generated by this assignment worried Aaron. Would he have to justify his recommendations to everyone in the company? Aaron quietly closed his office door. Based on the available information and his own knowledge of ABC systems, Aaron needed to complete a segment profitability analysis before his meeting with Joe in the morning. With all these interruptions, it was going to be a long night. Profitability Analysis at Best Potato Chips, Inc. Aaron Delaney, logistics manager at Best Potato Chips, Inc.., was faced with a difficult task. Joe Kik, the new vice president, had circulated a letter from Best Potato Chips' only mass merchandise customer, Value Savings Stores, complaining of poor operating performance. Among the problems cited by Value Savings Stores were: (1) frequent stockouts on store shelves (2) poor customer service responsiveness and (3) high prices for Best Potato Chips' products. The letter suggested that if Best Potato Chips were to remain a supplier to Value Savings Stores, it would need to eliminate stockouts by: (1) providing direct store delivery four times per week (instead of three) (2) installing an automated order inquiry system to increase customer service responsiveness ($600,000 investment) and (3) decreasing product prices paid by Value by 5 percent. While the previous vice president would most certainly have begun implementing the suggested changes, Joe Kik was different. He requested that Aaron prepare a detailed analysis of Best Potato Chips' profitability by segment. He also asked that it be prepared on a spreadsheet to permit some basic analysis. This was something that Aaron had never previously attempted, and it was needed first thing in the morning. Company Background Best Potato Chips, Inc., is the second largest potato chip producer in the mid-Michigan market. The company was founded in 1962 and following an unsuccessful attempt at national expansion has remained primarily a regional operation. The company currently manufactures and distributes several varieties of potato chips to three different types of retail accounts: grocery, drug, and mass merchandise. The largest percentage of business is concentrated in the grocery segment, with 450 retail customer locations accounting for 6,100,000 annual Page 428 unit sales and more than 65 percent of annual revenue. The drug segment comprises 240 customer locations which account for 1,200,000 annual unit sales and about 13 percent of annual revenue. In the mass merchandise segment, Best Potato Chips has one customer (Value Savings) with 36 locations that account for 2,400,000 annual unit sales and almost 22 percent of annual revenue. All distribution is store-direct, with delivery drivers handling returns of outdated material and all shelf placement and merchandising. Recently, Best Potato Chips has actively sought growth in the mass merchandise segment because of the perceived profit potential. However, while the company is acutely aware of overall business profitability, there has never been an analysis on a customer segment basis. Performance Statistics Aaron recently attended a seminar at a major midwestern university concerning activity-based costing. He was anxious to apply the techniques he had learned at the seminar to the current situation, but was unsure exactly how to proceed. He did not understand the relationship between activity-based costing and segment profitability analysis, but he knew the first step in either is to identify relevant costs. Aaron obtained a copy of Best Potato Chips' most recent income statement (@Table 1). TABLE 1 Income Statement Income $17,710,000 Net Sales Cost and Expenses Cost of Goods Sold Marketing, Sales, Logistics and Other Expenses Total Costs and Expenses $11,359,000 5,312,000 $16,771,000 Earnings before Income Taxes $939,000 He also knew specific information concerning logistic costs by segment (Table 2). All deliveries were store-direct with two deliveries per week to grocery stores, one delivery per week to drug stores and three deliveries per week to mass merchandiser stores. The cost of delivery to each store was dependent on the type of vehicle used and the amount of time spent at store locations. Standard route trucks were used for drug stores and grocery stores, while extended vehicles were used to accommodate the volume at mass merchandisers. TABLE 2 Annual Logistics Costs by Segment Cost Category/Segment Grocery Drug Mass Merchandise Stocking Cost ($/Delivery) $25 $20 $50 Delivery Cost ($/Delivery) $30 $30 $55 Delivery Cost ($/Delivery) $30 $30 $55 Trade prices for grocery and drug stores were $ 1.90 per unit and $1.60 for Value Savings. Aaron was also aware that Value Savings Stores required Best Potato Chips to cover the suggested retail price with a sticker bearing its (reduced) retail price. The machinery required to apply these labels had an annual lease cost of $60,000.00. Labor and materials for the labels cost an additional $.06 per unit. Conclusion As Aaron sat in his office compiling information to complete the segment profitability analysis, he received several unsolicited offers for assistance. Bill Smith, manager marketing, urged him not to bother with the analysis: Value Savings Stores is clearly our single most important customer. Look at the sales per store. We should immediately implement the suggested changes. Steve Brown, director of manufacturing, disagreed. He felt the additional manufacturing cost required to meet Value Savings Page 429 Stores' requirements was too high: We should let Value Savings Stores know what we really think about their special requirements. Stickers, of all things! What business do they think we are in? The sales force had a different opinion. Jake Williams felt the grocery segment was most important: Just look at that volume! How could they be anything but our best customers? The broad interest being generated by this assignment worried Aaron. Would he have to justify his recommendations to everyone in the company? Aaron quietly closed his office door. Based on the available information and his own knowledge of ABC systems, Aaron needed to complete a segment profitability analysis before his meeting with Joe in the morning. With all these interruptions, it was going to be a long nightStep by Step Solution
There are 3 Steps involved in it
Step: 1

Get Instant Access to Expert-Tailored Solutions
See step-by-step solutions with expert insights and AI powered tools for academic success
Step: 2

Step: 3
Ace Your Homework with AI
Get the answers you need in no time with our AI-driven, step-by-step assistance
Get Started
Meetings Expositions Events And Conventions An Introduction To The Industry
Authors: George G. Fenich
4th Global Edition
1292093765, 9781292093765