

Answered step by step
Verified Expert Solution
Question
1 Approved Answer
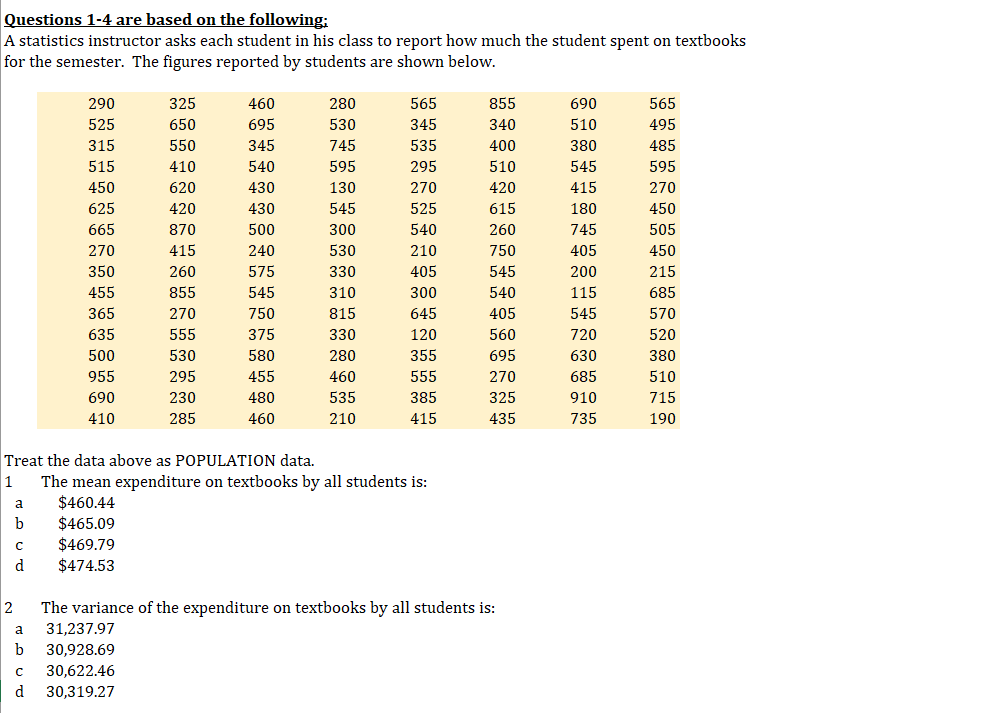
Questions 1-4 are based on the following; A statistics instructor asks each student in his class to report how much the student spent on textbooks


Step by Step Solution
There are 3 Steps involved in it
Step: 1

Get Instant Access to Expert-Tailored Solutions
See step-by-step solutions with expert insights and AI powered tools for academic success
Step: 2

Step: 3
Ace Your Homework with AI
Get the answers you need in no time with our AI-driven, step-by-step assistance
Get Started
Economics For Environmental Studies A Strategic Guide To Micro-And Macroeconomics
Authors: Alfred Endres, Volker Radke
2012th Edition
364231192X, 978-3642311925