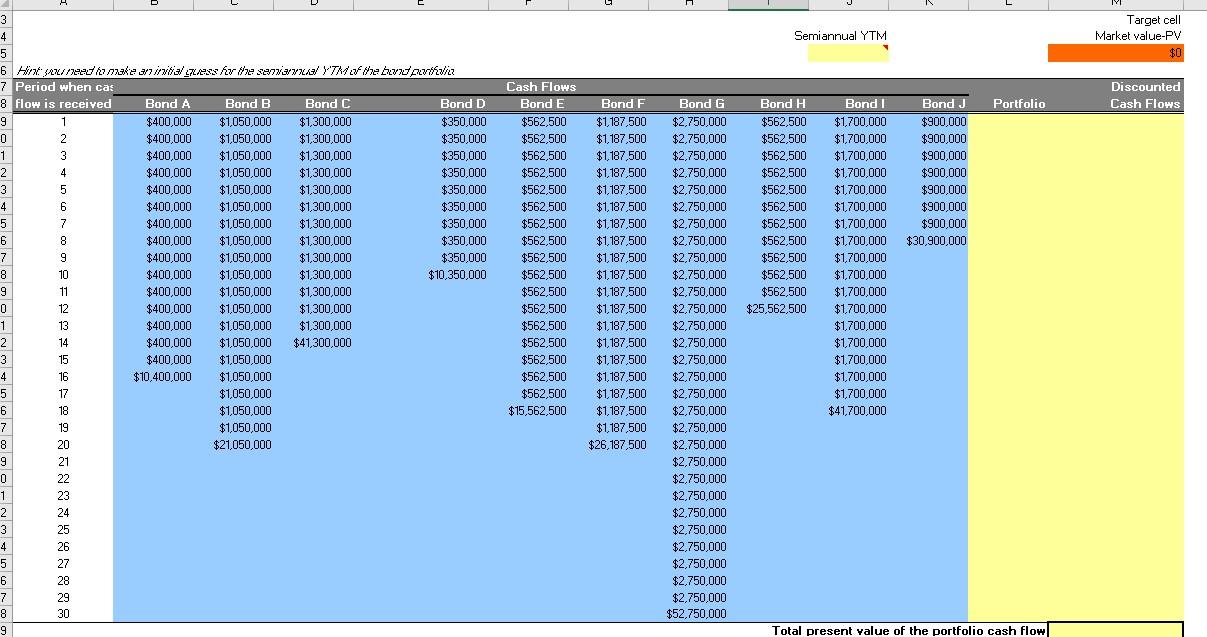

Questions 15 Suppose you have a portfolio of ten semiannual coupon bonds, as shown below. After calculating the total market value of the portfolio, find the portfolio semiannual YTM. Hint: This is another Goal Seek problem. If you know the portfolio value and its cash flows, then the semiannual YTM will be the rate at which you discount the portfolio cash flows to obtain the portfolio value Bond D Coupon Rate Maturity (yrs) 8.0% 8 10.5% 10 6.5% 7 7.0% 5 7.5% 9 9.5% 10 11.0% 15 4.5% 6 8.5% 8 6.0% 4 Semiannual Coupon Par Value($) Payment $10,000,000 $400,000 $20,000,000 $1,050,000 $40,000,000 $1,300,000 $10,000,000 $350,000 $15,000,000 $562,500 $25,000,000 $1,187,500 $50,000,000 $2,750,000 $25,000,000 $562,500 $40,000,000 $1,700,000 $30,000,000 $900,000 Total market value of portfolio Price Value ($) $11,256,110 $20,000,000 $35,843,640 $10,000,000 $14,525,276 $25,000,000 $58,144,444 $22,548,231 $43,628,235 $28,469,371 YTM 6.0% 10.5% 8.5% 7.0% 8.0% 9.5% 9.0% 6.5% 7.0% 7.5% F G ] Semiannual YTM Target cell Market value-PV $0 Discounted Cash Flows Portfolio Bond J $900.000 $900,000 $900,000 $900,000 $900.000 $900,000 $900,000 $30,900,000 3 4 5 6 AX AX 12-J'A7 rue 377 // waldzess hvide se71373/ YTM te huvitav.cz 7 Period when cas 8 flow is received Bond A Bond B Bond C Bond D 9 1 $400,000 $1,050,000 $1,300,000 $350,000 0 2 $400,000 $1,050,000 $1,300,000 $350.000 1 1 3 $400,000 $1,050,000 $1,300,000 $350,000 2 4 $400,000 $1,050,000 $1,300,000 $350,000 3 5 $400,000 $1,050,000 $1,300,000 $350,000 4 6 $400,000 $1,050,000 $1,300,000 $350,000 5 7 $400,000 $1,050,000 $1,300,000 $350.000 6 6 8 $400,000 $1,050,000 $1,300,000 $350,000 7 9 $400,000 $1,050,000 $1,300,000 $350,000 8 10 $ $400,000 $1,050,000 $1,300,000 $10,350,000 9 11 $400.000 $1,050.000 $1.300.000 0 12 $400,000 $1,050,000 $1,300,000 1 13 $400,000 $1,050,000 $1,300,000 2 14 $400,000 $1,050,000 $41.300.000 3 15 $400,000 $1,050,000 4 16 $10,400,000 $1,050,000 5 17 $1,050,000 6 18 $1,050.000 7 19 $1,050,000 8 20 $21,050,000 9 21 0 22 1 1 23 2 24 3 25 4 26 5 27 6 28 7 29 8 30 9 M Cash Flows Bond E $562,500 $562,500 $562,500 $562,500 $562,500 $562,500 $562,500 $562,500 $562,500 $562,500 $562,500 $562,500 $562,500 $562,500 $562,500 $562,500 $562,500 $15,562,500 Bond H $562,500 $562,500 $562,500 $562,500 $562,500 $562,500 $562,500 $562,500 $562,500 $562,500 $562,500 $25,562,500 Bond F $1,187,500 $1,187.500 $1,187.500 $1,187,500 $1,187,500 $1,187,500 $1,187,500 $1,187,500 $1,187,500 $1,187,500 $1,187,500 $1,187,500 $1,187,500 $1,187,500 $1,187.500 $1,187,500 $1,187,500 $1,187,500 $1,187,500 $26, 187,500 Bond G $2,750,000 $2,750,000 $2,750,000 $2,750,000 $2,750,000 $2,750,000 $2,750,000 $2,750,000 $2,750,000 $2,750,000 $2,750,000 $2,750,000 $2,750,000 $2,750,000 $2,750,000 $2,750,000 $2,750,000 $2,750,000 $2,750,000 $2,750,000 $2,750,000 $2,750,000 $2,750,000 $2,750,000 $2,750,000 $2,750,000 $2,750,000 $2,750,000 $2,750,000 $52,750,000 Bond I $1,700,000 $1,700,000 $1,700,000 $1,700,000 $1,700,000 $1700,000 $1,700,000 $1,700,000 $1,700,000 $1,700,000 $1,700,000 $1,700,000 $1,700,000 $1,700,000 $1,700,000 $1,700,000 $1,700,000 $41,700,000 Total present value of the portfolio cash flow Questions 15 Suppose you have a portfolio of ten semiannual coupon bonds, as shown below. After calculating the total market value of the portfolio, find the portfolio semiannual YTM. Hint: This is another Goal Seek problem. If you know the portfolio value and its cash flows, then the semiannual YTM will be the rate at which you discount the portfolio cash flows to obtain the portfolio value Bond D Coupon Rate Maturity (yrs) 8.0% 8 10.5% 10 6.5% 7 7.0% 5 7.5% 9 9.5% 10 11.0% 15 4.5% 6 8.5% 8 6.0% 4 Semiannual Coupon Par Value($) Payment $10,000,000 $400,000 $20,000,000 $1,050,000 $40,000,000 $1,300,000 $10,000,000 $350,000 $15,000,000 $562,500 $25,000,000 $1,187,500 $50,000,000 $2,750,000 $25,000,000 $562,500 $40,000,000 $1,700,000 $30,000,000 $900,000 Total market value of portfolio Price Value ($) $11,256,110 $20,000,000 $35,843,640 $10,000,000 $14,525,276 $25,000,000 $58,144,444 $22,548,231 $43,628,235 $28,469,371 YTM 6.0% 10.5% 8.5% 7.0% 8.0% 9.5% 9.0% 6.5% 7.0% 7.5% F G ] Semiannual YTM Target cell Market value-PV $0 Discounted Cash Flows Portfolio Bond J $900.000 $900,000 $900,000 $900,000 $900.000 $900,000 $900,000 $30,900,000 3 4 5 6 AX AX 12-J'A7 rue 377 // waldzess hvide se71373/ YTM te huvitav.cz 7 Period when cas 8 flow is received Bond A Bond B Bond C Bond D 9 1 $400,000 $1,050,000 $1,300,000 $350,000 0 2 $400,000 $1,050,000 $1,300,000 $350.000 1 1 3 $400,000 $1,050,000 $1,300,000 $350,000 2 4 $400,000 $1,050,000 $1,300,000 $350,000 3 5 $400,000 $1,050,000 $1,300,000 $350,000 4 6 $400,000 $1,050,000 $1,300,000 $350,000 5 7 $400,000 $1,050,000 $1,300,000 $350.000 6 6 8 $400,000 $1,050,000 $1,300,000 $350,000 7 9 $400,000 $1,050,000 $1,300,000 $350,000 8 10 $ $400,000 $1,050,000 $1,300,000 $10,350,000 9 11 $400.000 $1,050.000 $1.300.000 0 12 $400,000 $1,050,000 $1,300,000 1 13 $400,000 $1,050,000 $1,300,000 2 14 $400,000 $1,050,000 $41.300.000 3 15 $400,000 $1,050,000 4 16 $10,400,000 $1,050,000 5 17 $1,050,000 6 18 $1,050.000 7 19 $1,050,000 8 20 $21,050,000 9 21 0 22 1 1 23 2 24 3 25 4 26 5 27 6 28 7 29 8 30 9 M Cash Flows Bond E $562,500 $562,500 $562,500 $562,500 $562,500 $562,500 $562,500 $562,500 $562,500 $562,500 $562,500 $562,500 $562,500 $562,500 $562,500 $562,500 $562,500 $15,562,500 Bond H $562,500 $562,500 $562,500 $562,500 $562,500 $562,500 $562,500 $562,500 $562,500 $562,500 $562,500 $25,562,500 Bond F $1,187,500 $1,187.500 $1,187.500 $1,187,500 $1,187,500 $1,187,500 $1,187,500 $1,187,500 $1,187,500 $1,187,500 $1,187,500 $1,187,500 $1,187,500 $1,187,500 $1,187.500 $1,187,500 $1,187,500 $1,187,500 $1,187,500 $26, 187,500 Bond G $2,750,000 $2,750,000 $2,750,000 $2,750,000 $2,750,000 $2,750,000 $2,750,000 $2,750,000 $2,750,000 $2,750,000 $2,750,000 $2,750,000 $2,750,000 $2,750,000 $2,750,000 $2,750,000 $2,750,000 $2,750,000 $2,750,000 $2,750,000 $2,750,000 $2,750,000 $2,750,000 $2,750,000 $2,750,000 $2,750,000 $2,750,000 $2,750,000 $2,750,000 $52,750,000 Bond I $1,700,000 $1,700,000 $1,700,000 $1,700,000 $1,700,000 $1700,000 $1,700,000 $1,700,000 $1,700,000 $1,700,000 $1,700,000 $1,700,000 $1,700,000 $1,700,000 $1,700,000 $1,700,000 $1,700,000 $41,700,000 Total present value of the portfolio cash flow


