

Answered step by step
Verified Expert Solution
Question
1 Approved Answer
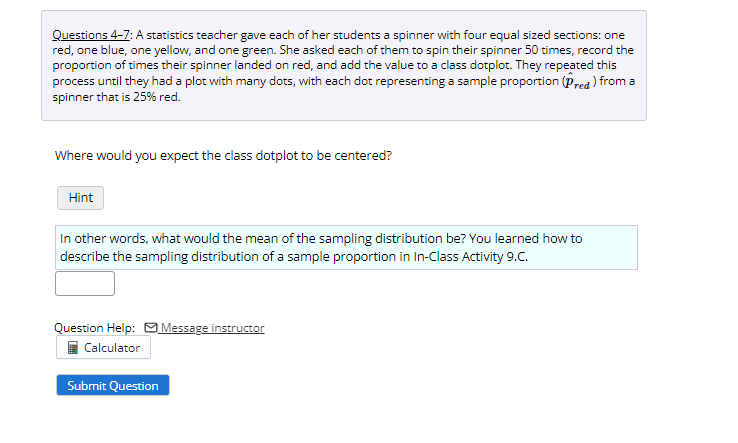
Questions 4-7: A statistics teacher gave each of her students a spinner with four equal sized sections: one red, one blue, one yellow, and one
Step by Step Solution
There are 3 Steps involved in it
Step: 1

Get Instant Access to Expert-Tailored Solutions
See step-by-step solutions with expert insights and AI powered tools for academic success
Step: 2

Step: 3
Ace Your Homework with AI
Get the answers you need in no time with our AI-driven, step-by-step assistance
Get Started
Concepts In Complex Analysis
Authors: Rashmi Rana
1st Edition
9353146461, 9789353146467