

Question: questions 6,7,9,13 Questions using the chart captured in the picture above stock price remains constant. Use the spread September 30, and October 16. Assume that
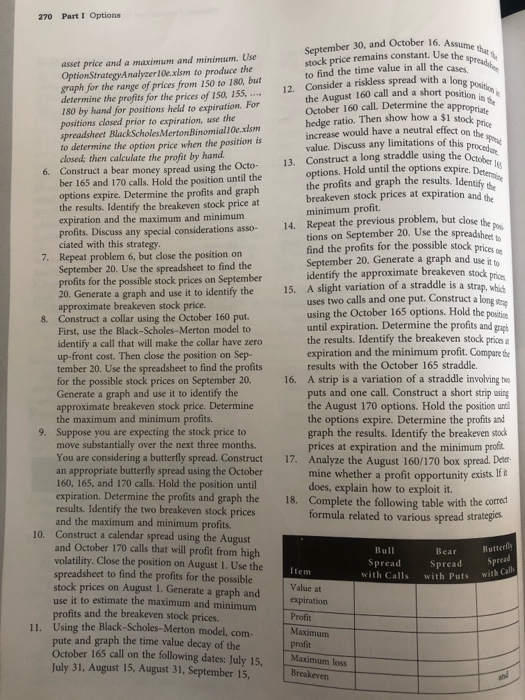
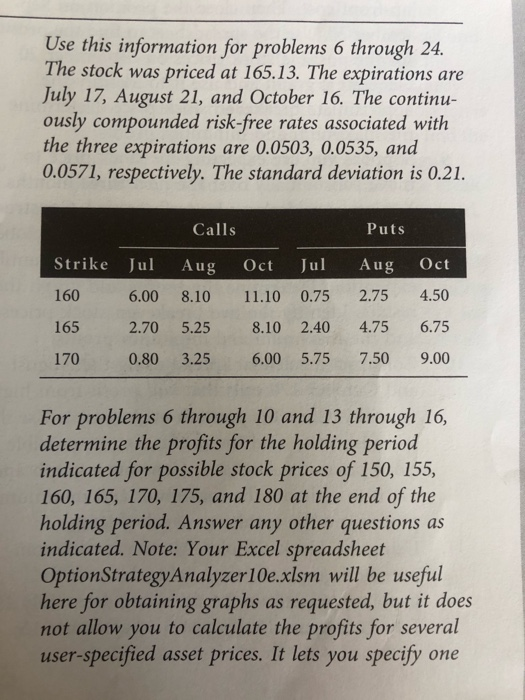
stock price remains constant. Use the spread September 30, and October 16. Assume that to find the time value in all the cases 12. Consider a riskless spread with a long po the August 160 call and a short position in the October 160 call. Determine the appropriate hedge ratio. Then show how a $1 stock prict increase would have a neutral effect on the value. Discuss any limitations of this procedunt 13. Construct a long straddle using the October options. Hold until the options expire. Determine the profits and graph the results. Identify the 14. Repeat the previous problem, but close the tions on September 20. Use the spreadsheet 270 Part 1 Options asset price and a maximum and minimum. Use Option StrategyAnalyzer 10e.xlsm to produce the graph for the range of prices from 150 to 180, but determine the profits for the prices of 150, 155,.... 180 by hand for positions held to expiration. For positions closed prior to expiration, use the spreadsheet BlackScholes Merton Binomial10e.xdsm to determine the option price when the position is closed; then calculate the profit by hand. 6. Construct a bear money spread using the Octo- ber 165 and 170 calls. Hold the position until the options expire. Determine the profits and graph breakeven stock prices at expiration and the the results. Identify the breakeven stock price at minimum profit. expiration and the maximum and minimum profits. Discuss any special considerations asso ciated with this strategy. find the profits for the possible stock prices 7. Repeat problem 6, but close the position on September 20. Generate a graph and use it to September 20. Use the spreadsheet to find the profits for the possible stock prices on September identify the approximate breakeven stock price 20. Generate a graph and use it to identify the 15. A slight variation of a straddle is a strap, which approximate breakeven stock price. uses two calls and one put. Construct a long step 8. Construct a collar using the October 160 put. using the October 165 options. Hold the position First, use the Black-Scholes-Merton model to until expiration. Determine the profits and graph identify a call that will make the collar have zero the results. Identify the breakeven stock prices at up-front cost. Then close the position on Sep. expiration and the minimum profit. Compare the tember 20. Use the spreadsheet to find the profits results with the October 165 straddle. for the possible stock prices on September 20. 16. A strip is a variation of a straddle involving to Generate a graph and use it to identify the puts and one call. Construct a short strip using approximate breakeven stock price. Determine the August 170 options. Hold the position until the maximum and minimum profits. the options expire. Determine the profits and 9. Suppose you are expecting the stock price to graph the results. Identify the breakeven stock move substantially over the next three months. prices at expiration and the minimum profit. You are considering a butterfly spread. Construct 17. Analyze the August 160/170 box spread. Deter an appropriate butterfly spread using the October mine whether a profit opportunity exists. If 160, 165, and 170 calls. Hold the position until does, explain how to exploit it. expiration. Determine the profits and graph the results. Identify the two breakeven stock prices 18. Complete the following table with the correct and the maximum and minimum profits. formula related to various spread strategies 10. Construct a calendar spread using the August and October 170 calls that will profit from high Bull Bear volatility. Close the position on August 1. Use the Spread Spread spreadsheet to find the profits for the possible with Calls with Puts stock prices on August 1. Generate a graph and use it to estimate the maximum and minimum profits and the breakeven stock prices. 11. Using the Black-Scholes-Merton model, com- pute and graph the time value decay of the October 165 call on the following dates: July 15, July 31, August 15, August 31, September 15, Butterfly Spread with Calle Item Value at expiration Profit Maximum profit Maximum loss Breakeven Use this information for problems 6 through 24. The stock was priced at 165.13. The expirations are July 17, August 21, and October 16. The continu- ously compounded risk-free rates associated with the three expirations are 0.0503, 0.0535, and 0.0571, respectively. The standard deviation is 0.21. Calls Puts Strike Jul Aug Oct Jul Aug Oct 160 6.00 8.10 11.10 0.75 2.75 4.50 165 2.70 5.25 8.10 2.40 4.75 6.75 170 0.80 3.25 6.00 5.75 7.50 9.00 For problems 6 through 10 and 13 through 16, determine the profits for the holding period indicated for possible stock prices of 150, 155, 160, 165, 170, 175, and 180 at the end of the holding period. Answer any other questions as indicated. Note: Your Excel spreadsheet OptionStrategyAnalyzer10e.xlsm will be useful here for obtaining graphs as requested, but it does not allow you to calculate the profits for several user-specified asset prices. It lets you specify one stock price remains constant. Use the spread September 30, and October 16. Assume that to find the time value in all the cases 12. Consider a riskless spread with a long po the August 160 call and a short position in the October 160 call. Determine the appropriate hedge ratio. Then show how a $1 stock prict increase would have a neutral effect on the value. Discuss any limitations of this procedunt 13. Construct a long straddle using the October options. Hold until the options expire. Determine the profits and graph the results. Identify the 14. Repeat the previous problem, but close the tions on September 20. Use the spreadsheet 270 Part 1 Options asset price and a maximum and minimum. Use Option StrategyAnalyzer 10e.xlsm to produce the graph for the range of prices from 150 to 180, but determine the profits for the prices of 150, 155,.... 180 by hand for positions held to expiration. For positions closed prior to expiration, use the spreadsheet BlackScholes Merton Binomial10e.xdsm to determine the option price when the position is closed; then calculate the profit by hand. 6. Construct a bear money spread using the Octo- ber 165 and 170 calls. Hold the position until the options expire. Determine the profits and graph breakeven stock prices at expiration and the the results. Identify the breakeven stock price at minimum profit. expiration and the maximum and minimum profits. Discuss any special considerations asso ciated with this strategy. find the profits for the possible stock prices 7. Repeat problem 6, but close the position on September 20. Generate a graph and use it to September 20. Use the spreadsheet to find the profits for the possible stock prices on September identify the approximate breakeven stock price 20. Generate a graph and use it to identify the 15. A slight variation of a straddle is a strap, which approximate breakeven stock price. uses two calls and one put. Construct a long step 8. Construct a collar using the October 160 put. using the October 165 options. Hold the position First, use the Black-Scholes-Merton model to until expiration. Determine the profits and graph identify a call that will make the collar have zero the results. Identify the breakeven stock prices at up-front cost. Then close the position on Sep. expiration and the minimum profit. Compare the tember 20. Use the spreadsheet to find the profits results with the October 165 straddle. for the possible stock prices on September 20. 16. A strip is a variation of a straddle involving to Generate a graph and use it to identify the puts and one call. Construct a short strip using approximate breakeven stock price. Determine the August 170 options. Hold the position until the maximum and minimum profits. the options expire. Determine the profits and 9. Suppose you are expecting the stock price to graph the results. Identify the breakeven stock move substantially over the next three months. prices at expiration and the minimum profit. You are considering a butterfly spread. Construct 17. Analyze the August 160/170 box spread. Deter an appropriate butterfly spread using the October mine whether a profit opportunity exists. If 160, 165, and 170 calls. Hold the position until does, explain how to exploit it. expiration. Determine the profits and graph the results. Identify the two breakeven stock prices 18. Complete the following table with the correct and the maximum and minimum profits. formula related to various spread strategies 10. Construct a calendar spread using the August and October 170 calls that will profit from high Bull Bear volatility. Close the position on August 1. Use the Spread Spread spreadsheet to find the profits for the possible with Calls with Puts stock prices on August 1. Generate a graph and use it to estimate the maximum and minimum profits and the breakeven stock prices. 11. Using the Black-Scholes-Merton model, com- pute and graph the time value decay of the October 165 call on the following dates: July 15, July 31, August 15, August 31, September 15, Butterfly Spread with Calle Item Value at expiration Profit Maximum profit Maximum loss Breakeven Use this information for problems 6 through 24. The stock was priced at 165.13. The expirations are July 17, August 21, and October 16. The continu- ously compounded risk-free rates associated with the three expirations are 0.0503, 0.0535, and 0.0571, respectively. The standard deviation is 0.21. Calls Puts Strike Jul Aug Oct Jul Aug Oct 160 6.00 8.10 11.10 0.75 2.75 4.50 165 2.70 5.25 8.10 2.40 4.75 6.75 170 0.80 3.25 6.00 5.75 7.50 9.00 For problems 6 through 10 and 13 through 16, determine the profits for the holding period indicated for possible stock prices of 150, 155, 160, 165, 170, 175, and 180 at the end of the holding period. Answer any other questions as indicated. Note: Your Excel spreadsheet OptionStrategyAnalyzer10e.xlsm will be useful here for obtaining graphs as requested, but it does not allow you to calculate the profits for several user-specified asset prices. It lets you specify one
Step by Step Solution
There are 3 Steps involved in it

Get step-by-step solutions from verified subject matter experts