Answered step by step
Verified Expert Solution
Link Copied!

Question

1 Approved Answer

Questions: At least 2 of your quantitative variables anddetermine if they are skewed. Describe the results - and show us the graph/table/plot/figure so we can

Questions:

  1. At least 2 of your quantitative variables anddetermine if they are skewed. Describe the results - and show us the graph/table/plot/figure so we can see them!
  2. Explain how the Central Limit Theorem can help skewed data achieve normality.
  3. Using the same dataset, create confidence intervals for 2 of your quantitative variables. Interpret the results using APA 7.
  4. For each, explain whether you used the Student's t or z distribution, and why.
  5. For each, explain what type of Confidence Interval you used, and why.

Below is for your references:

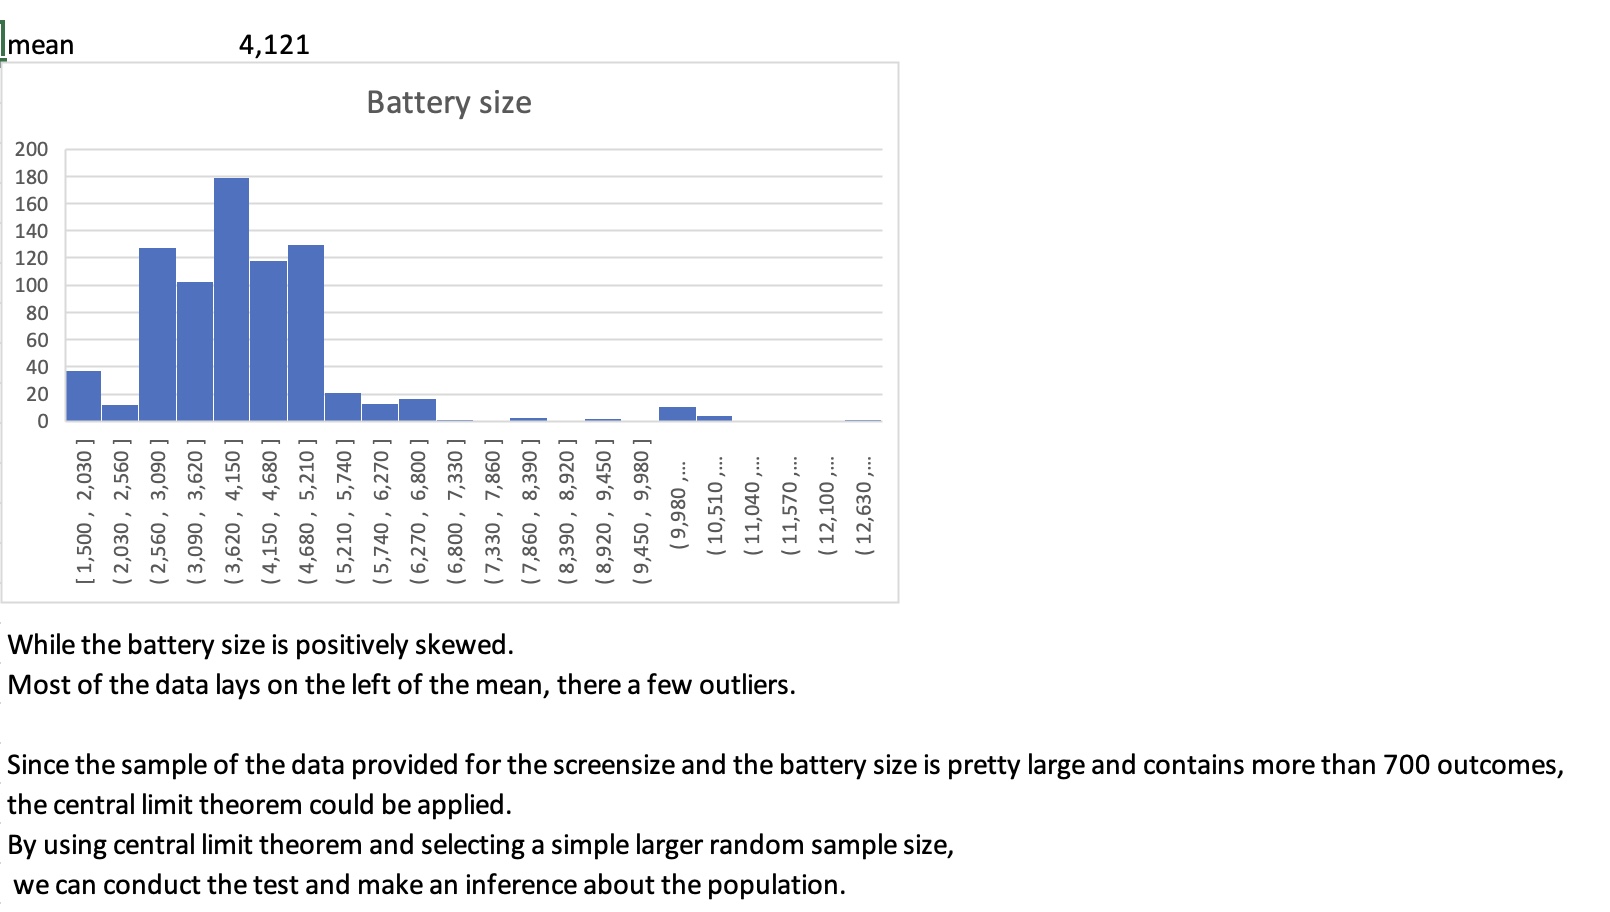
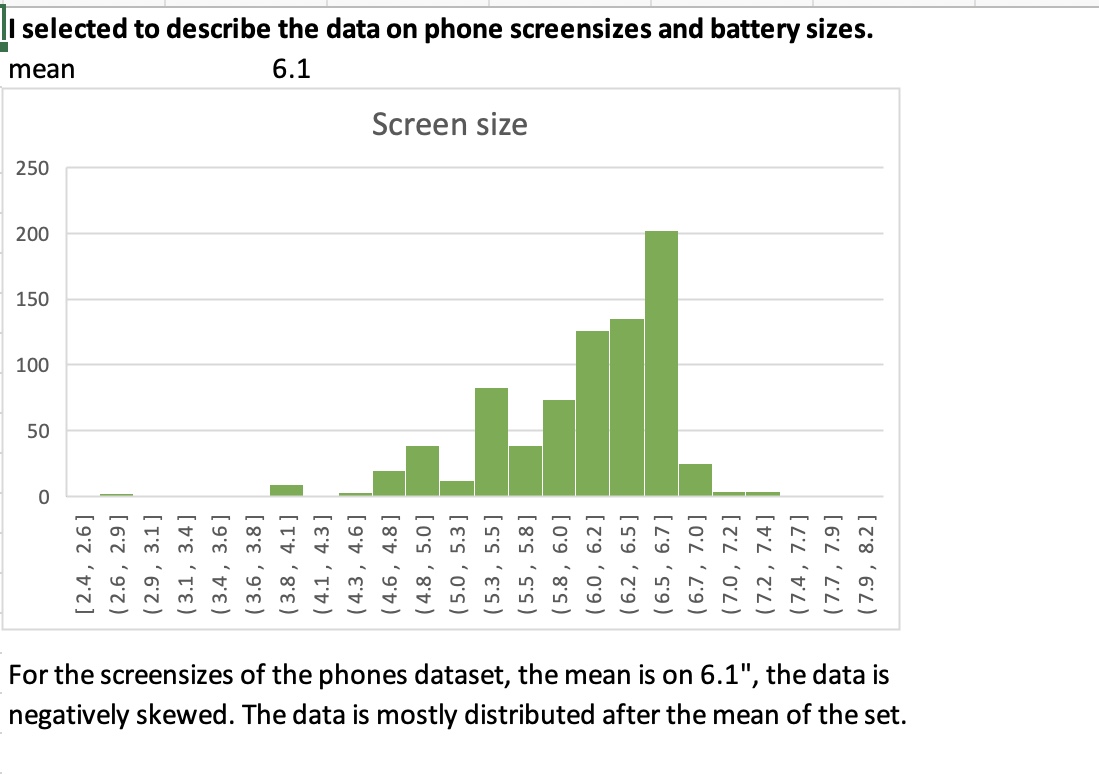
1. Please, see the attached screenshots and the excel itself. I selected to work with the screensize and battery size of the phones dataset. Both of them are skewed as described below.

2. The Central limit theorem can help to normalize the distribution, when the sample size is large enough (at least more than 30). If we cantake sufficiently large random samples from the population with replacement, then the distribution of the sample means will be approximately normally distributed.

image text in transcribedimage text in transcribed
180 140 200 120 100 160 40 80 mean 20 8 [ 1,500 , 2,030 ] ( 2,030 , 2,560 ] ( 2,560 , 3,090 ] ( 3,090 , 3,620 ] ( 3,620 , 4,150 ] the central limit theorem could be applied. While the battery size is positively skewed. ( 4,150 , 4,680 ] 4,121 ( 4,680 , 5,210 ] (5,210 , 5,740 ] (5,740 , 6,270 ] Most of the data lays on the left of the mean, there a few outliers. ( 6,270 , 6,800 ] we can conduct the test and make an inference about the population. (6,800 , 7,330 ] Battery size By using central limit theorem and selecting a simple larger random sample size, (7,330 , 7,860 ] (7,860 , 8,390 ] (8,390 , 8,920 ] (8,920 , 9,450 ] (9,450 , 9,980 ] (9,980 ,... ( 10,510 ,... ( 11,040 ,... Since the sample of the data provided for the screensize and the battery size is pretty large and contains more than 700 outcomes, ( 11,570 ,... ( 12, 100 ,... (12,630 ,...250 200 150 100 mean 50 0 [2.4, 2.6] (2.6 , 2.9] ( 2.9 , 3.1 ] (3.1, 3.4 ] (3.4 , 3.6] (3.6 , 3.8 ] (3.8, 4.1 ] 6.1 ( 4.1 , 4.3] ( 4.3 , 4.6] ( 4.6 , 4.8 ] ( 4.8 , 5.0] I selected to describe the data on phone screensizes and battery sizes. Screen size For the screensizes of the phones dataset, the mean is on 6.1", the data is negatively skewed. The data is mostly distributed after the mean of the set. (5.0 , 5.3 ] (5.3 , 5.5] ( 5.5 , 5.8 ] (5.8 , 6.0 ] (6.0 , 6.2] ( 6.2 , 6.5] (6.5 , 6.7 ] (6.7 , 7.0 ] (7.0 , 7.2] (7.2, 7.4 ] (7.4, 7.7] (7.7 , 7.9 ] (7.9, 8.2]

Step by Step Solution

There are 3 Steps involved in it

Step: 1

blur-text-image

Get Instant Access to Expert-Tailored Solutions

See step-by-step solutions with expert insights and AI powered tools for academic success

Step: 2

blur-text-image

Step: 3

blur-text-image

Ace Your Homework with AI

Get the answers you need in no time with our AI-driven, step-by-step assistance

Get Started

Recommended Textbook for

Precalculus Enhanced With Graphing Utilities

Authors: Michael Sullivan, Michael Sullivan III

7th Edition

0134268210, 9780134268217

More Books

Students also viewed these Mathematics questions

Question

How do the two components of this theory work together?

Answered: 1 week ago