Answered step by step
Verified Expert Solution
Link Copied!

Question

1 Approved Answer

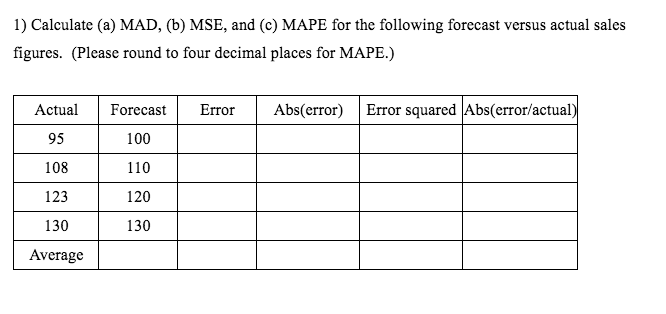
Questions JPEG 1) Calculate (a) MAD, (b) MSE, and (c) MAPE for the following forecast versus actual sales figures. (Please round to four decimal places

Questions JPEG

image text in transcribedimage text in transcribed
1) Calculate (a) MAD, (b) MSE, and (c) MAPE for the following forecast versus actual sales figures. (Please round to four decimal places for MAPE.) Actual Forecast Error Abs(error) Error squared Abs(error/actual) 95 100 108 110 123 120 130 130 Average2) Demand for a particular type of battery fluctuates from one week to the next. A study of the last six weeks provides the following demands: Demand Forecast Week 1 400 Week 2 500 Week 300 Week 4 200 Week 5 800 Week 6 00 Week 7 Forecast demand for week 4 through week 7 using a three-week moving average. 3) Daily demand for newspapers for the last 7 days has been as follows: Daily Demand Forecast Day 1 12 Day 2 13 Day 3 16 Day 4 15 Day 5 12 Day 6 18 Day 7 14 Day 8 Forecast sales for the next day using a three-day weighted moving average where the weights are 3, 1, and 1 (the highest weight is for the most recent number). (Round answers to the nearest whole number) 4) Use simple exponential smoothing with a = 0.3 to forecast the tire sales for February through May. Assume that the forecast for January was for 22 sets of tires. (Round answers to the nearest whole number) Month Tire Sales Forecast anuary 28 22 February 21 March 39 April 34 May 5) Given the following sales data: Month Sales (in thousand units) Year Year 2 Jan 8 8 Feb 7 9 Mar 5 Apr 10 May 9 12 June 12 16 July 15 20 Aug 20 25 Sept Oct Nov Dec a) Compute the seasonal index for each month using the above data. b) Forecast the sales for each month of year 3, adjusting for seasonality, assuming the annual demand of 240,000 units. 6) To predict Sales for the next year, a business analyst collected 4 years of quarterly sales data (in $millions) and obtained the following regression equation: Y-hat = 281.6 + 3.7t-75.7Q1 -48.9Q2 - 52.1Q3 where t = time period (1, 2, 3, . . . , 16) Q1 = 1 if quarter 1; 0 otherwise Q2 = 1 if quarter 2; 0 otherwise Q3 = 1 if quarter 3; 0 otherwise Note: if Q1 = Q2 = Q3 = 0, then it is quarter 4. Find the forecasts for the next 4 quarters

Step by Step Solution

There are 3 Steps involved in it

Step: 1

blur-text-image

Get Instant Access to Expert-Tailored Solutions

See step-by-step solutions with expert insights and AI powered tools for academic success

Step: 2

blur-text-image

Step: 3

blur-text-image

Ace Your Homework with AI

Get the answers you need in no time with our AI-driven, step-by-step assistance

Get Started

Recommended Textbook for

Business Analytics Data Analysis and Decision Making

Authors: S. Christian Albright, Wayne L. Winston

5th edition

1133629601, 9781285965529 , 978-1133629603

More Books

Students also viewed these Mathematics questions

Question

Sketch the bases of trust

Answered: 1 week ago