

Question: questions numbers 13 14 and 15 170 call contract. Hold the position until Chapter 6 Basic Option Strategies 237 Puts Jul Oct Jul 5.25 8.10
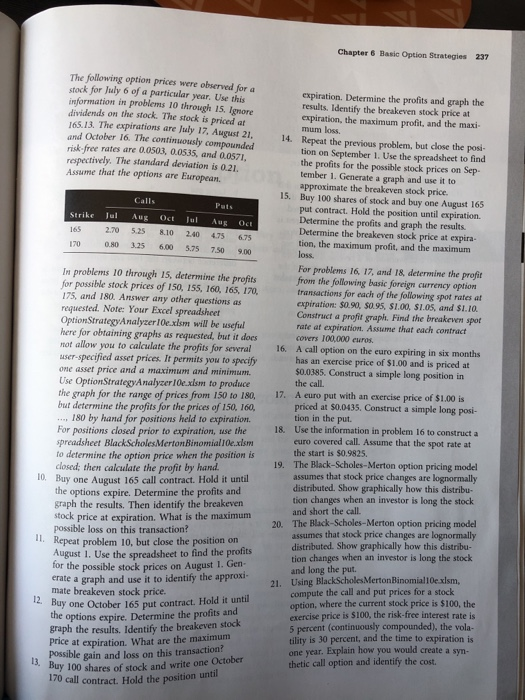
170 call contract. Hold the position until Chapter 6 Basic Option Strategies 237 Puts Jul Oct Jul 5.25 8.10 170 0.80 3.25 7.50 9.00 13. Buy 100 shares of stock and write one October The following option prices were observed for a stock for July 6 of a particular year. Use this information is problems 10 through 15. Ignore dividends on the stock. The stock is priced at 165.13. The expirations are July 17. August 21, and October 16. The continuously compounded risk-free rates are 0.0503, 0.0535, and 0.0571, respectively. The standard deviation is 0.21. Assume that the options are European Calls Strike Aug Oct 165 2.70 2.40 4.75 6.75 6,00 5.75 Int problems 10 through 15. determine the profits for possible stock prices of 150, 155, 160, 165, 170, 175 and 180. Answer any other questions as requested. Note: Your Excel spreadsheet Option Strategy Analyzer 10e.xlsm will be useful here for obtaining graphs as requested, but it does not allow you to calculate the profits for several user-specified asset prices. It permits you to specify one asset price and a maximum and minimum. Use Option Strategy Analyzer 10e.xlson to produce the graph for the range of prices from 150 to 180, but determine the profits for the prices of 150, 160, .... 180 by hand for positions held to expiration For positions closed prior to expiration, use the spreadsheet BlackScholes Merton Binomial10e.xlsm to determine the option price when the position is closed; then calculate the profit by hand. 10. Buy one August 165 call contract. Hold it until the options expire. Determine the profits and graph the results. Then identify the breakeven stock price at expiration. What is the maximum possible loss on this transaction? II. Repeat problem 10, but close the position on August 1. Use the spreadsheet to find the profits for the possible stock prices on August 1. Gen- erate a graph and use it to identify the approxi- mate breakeven stock price. 12. Buy one October 165 put contract. Hold it until the options expire. Determine the profits and graph the results. Identify the breakeven stock price at expiration. What are the maximum possible gain and loss on this transaction? expiration. Determine the profits and graph the results. Identify the breakeven stock price at expiration, the maximum profit, and the maxi- mum loss. 14. Repeat the previous problem, but close the posi tion on September 1. Use the spreadsheet to find the profits for the possible stock prices on Sep- tember 1. Generate a graph and use it to approximate the breakeven stock price. 15. Buy 100 shares of stock and buy one August 165 put contract. Hold the position until expiration Determine the profits and graph the results. Determine the breakeven stock price at expira- tion, the maximum profit, and the maximum loss. For problems 16. 17, and 18. determine the profit from the following basic foreign currency option transactions for each of the following spot rates at expiration: $0.90, $0.95, $1.00, $1.05, and $1.10. Construct a profit graph. Find the breakevent spot rate at expiration. Assume that each contract cover 100.000 euros. 16. A call option on the euro expiring in six months has an exercise price of $1.00 and is priced at $0.0385. Construct a simple long position in the call. 17. A euro put with an exercise price of $1.00 is priced at $0.0435. Construct a simple long posi- tion in the put 18. Use the information in problem 16 to construct a euro covered call. Assume that the spot rate at the start is $0.9825 19. The Black-Scholes-Merton option pricing model assumes that stock price changes are lognormally distributed. Show graphically how this distribu- tion changes when an investor is long the stock and short the call. 20. The Black-Scholes-Merton option pricing model assumes that stock price changes are lognormally distributed. Show graphically how this distribu- tion changes when an investor is long the stock and long the put. 21. Using BlackScholes Merton Binomial 10exism, compute the call and put prices for a stock option, where the current stock price is $100, the exercise price is $100, the risk-free interest rate is 5 percent (continuously compounded), the vola- tility is 30 percent, and the time to expiration is one year. Explain how you would create a syn- thetic call option and identify the cost. 170 call contract. Hold the position until Chapter 6 Basic Option Strategies 237 Puts Jul Oct Jul 5.25 8.10 170 0.80 3.25 7.50 9.00 13. Buy 100 shares of stock and write one October The following option prices were observed for a stock for July 6 of a particular year. Use this information is problems 10 through 15. Ignore dividends on the stock. The stock is priced at 165.13. The expirations are July 17. August 21, and October 16. The continuously compounded risk-free rates are 0.0503, 0.0535, and 0.0571, respectively. The standard deviation is 0.21. Assume that the options are European Calls Strike Aug Oct 165 2.70 2.40 4.75 6.75 6,00 5.75 Int problems 10 through 15. determine the profits for possible stock prices of 150, 155, 160, 165, 170, 175 and 180. Answer any other questions as requested. Note: Your Excel spreadsheet Option Strategy Analyzer 10e.xlsm will be useful here for obtaining graphs as requested, but it does not allow you to calculate the profits for several user-specified asset prices. It permits you to specify one asset price and a maximum and minimum. Use Option Strategy Analyzer 10e.xlson to produce the graph for the range of prices from 150 to 180, but determine the profits for the prices of 150, 160, .... 180 by hand for positions held to expiration For positions closed prior to expiration, use the spreadsheet BlackScholes Merton Binomial10e.xlsm to determine the option price when the position is closed; then calculate the profit by hand. 10. Buy one August 165 call contract. Hold it until the options expire. Determine the profits and graph the results. Then identify the breakeven stock price at expiration. What is the maximum possible loss on this transaction? II. Repeat problem 10, but close the position on August 1. Use the spreadsheet to find the profits for the possible stock prices on August 1. Gen- erate a graph and use it to identify the approxi- mate breakeven stock price. 12. Buy one October 165 put contract. Hold it until the options expire. Determine the profits and graph the results. Identify the breakeven stock price at expiration. What are the maximum possible gain and loss on this transaction? expiration. Determine the profits and graph the results. Identify the breakeven stock price at expiration, the maximum profit, and the maxi- mum loss. 14. Repeat the previous problem, but close the posi tion on September 1. Use the spreadsheet to find the profits for the possible stock prices on Sep- tember 1. Generate a graph and use it to approximate the breakeven stock price. 15. Buy 100 shares of stock and buy one August 165 put contract. Hold the position until expiration Determine the profits and graph the results. Determine the breakeven stock price at expira- tion, the maximum profit, and the maximum loss. For problems 16. 17, and 18. determine the profit from the following basic foreign currency option transactions for each of the following spot rates at expiration: $0.90, $0.95, $1.00, $1.05, and $1.10. Construct a profit graph. Find the breakevent spot rate at expiration. Assume that each contract cover 100.000 euros. 16. A call option on the euro expiring in six months has an exercise price of $1.00 and is priced at $0.0385. Construct a simple long position in the call. 17. A euro put with an exercise price of $1.00 is priced at $0.0435. Construct a simple long posi- tion in the put 18. Use the information in problem 16 to construct a euro covered call. Assume that the spot rate at the start is $0.9825 19. The Black-Scholes-Merton option pricing model assumes that stock price changes are lognormally distributed. Show graphically how this distribu- tion changes when an investor is long the stock and short the call. 20. The Black-Scholes-Merton option pricing model assumes that stock price changes are lognormally distributed. Show graphically how this distribu- tion changes when an investor is long the stock and long the put. 21. Using BlackScholes Merton Binomial 10exism, compute the call and put prices for a stock option, where the current stock price is $100, the exercise price is $100, the risk-free interest rate is 5 percent (continuously compounded), the vola- tility is 30 percent, and the time to expiration is one year. Explain how you would create a syn- thetic call option and identify the cost
Step by Step Solution
There are 3 Steps involved in it

Get step-by-step solutions from verified subject matter experts