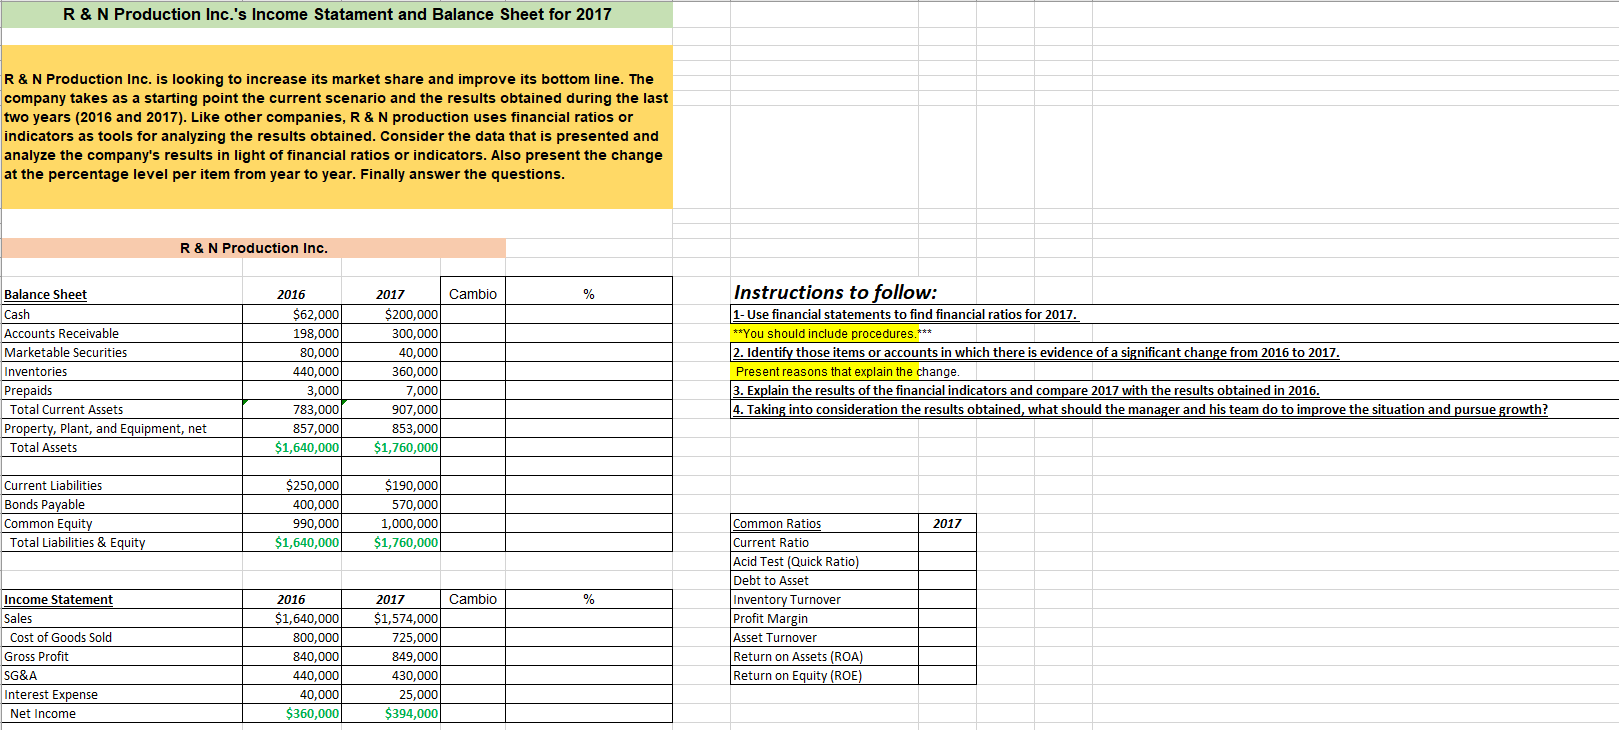
R & N Production Inc.'s Income Statament and Balance Sheet for 2017 R & N Production Inc. is looking to increase its market share and improve its bottom line. The company takes as a starting point the current scenario and the results obtained during the last two years (2016 and 2017). Like other companies, R & N production uses financial ratios or indicators as tools for analyzing the results obtained. Consider the data that is presented and analyze the company's results in light of financial ratios or indicators. Also present the change at the percentage level per item from year to year. Finally answer the questions. R & N Production Inc. Cambio % Balance Sheet Cash Accounts Receivable Marketable Securities Inventories Prepaids Total Current Assets Property, Plant, and Equipment, net Total Assets 2016 $62,000 198,000 80,000 440,000 3,000 783,000 857,000 $1,640,000 2017 $200,000 300,000 40,000 360,000 7,000 907,000 853,000 $1,760,000 Instructions to follow: 1 - Use financial statements to find financial ratios for 2017. **You should include procedures. *** 2. Identify those items or accounts in which there is evidence of a significant change from 2016 to 2017. Present reasons that explain the change. 3. Explain the results of the financial indicators and compare 2017 with the results obtained in 2016. 4. Taking into consideration the results obtained, what should the manager and his team do to improve the situation and pursue growth? Current Liabilities Bonds Payable Common Equity Total Liabilities & Equity $250,000 400,000 990,000 $1,640,000 $190,000 570,000 1,000,000 $1,760,000 2017 Cambio % Income Statement Sales Cost of Goods Sold Gross Profit SG&A Interest Expense Net Income 2016 $1,640,000 800,000 840,000 440,000 40,000 $360,000 2017 $1,574,000 725,000 849,000 430,000 25,000 $394,000 Common Ratios Current Ratio Acid Test (Quick Ratio) Debt to Asset Inventory Turnover Profit Margin Asset Turnover Return on Assets (ROA) Return on Equity (ROE) R & N Production Inc.'s Income Statament and Balance Sheet for 2017 R & N Production Inc. is looking to increase its market share and improve its bottom line. The company takes as a starting point the current scenario and the results obtained during the last two years (2016 and 2017). Like other companies, R & N production uses financial ratios or indicators as tools for analyzing the results obtained. Consider the data that is presented and analyze the company's results in light of financial ratios or indicators. Also present the change at the percentage level per item from year to year. Finally answer the questions. R & N Production Inc. Cambio % Balance Sheet Cash Accounts Receivable Marketable Securities Inventories Prepaids Total Current Assets Property, Plant, and Equipment, net Total Assets 2016 $62,000 198,000 80,000 440,000 3,000 783,000 857,000 $1,640,000 2017 $200,000 300,000 40,000 360,000 7,000 907,000 853,000 $1,760,000 Instructions to follow: 1 - Use financial statements to find financial ratios for 2017. **You should include procedures. *** 2. Identify those items or accounts in which there is evidence of a significant change from 2016 to 2017. Present reasons that explain the change. 3. Explain the results of the financial indicators and compare 2017 with the results obtained in 2016. 4. Taking into consideration the results obtained, what should the manager and his team do to improve the situation and pursue growth? Current Liabilities Bonds Payable Common Equity Total Liabilities & Equity $250,000 400,000 990,000 $1,640,000 $190,000 570,000 1,000,000 $1,760,000 2017 Cambio % Income Statement Sales Cost of Goods Sold Gross Profit SG&A Interest Expense Net Income 2016 $1,640,000 800,000 840,000 440,000 40,000 $360,000 2017 $1,574,000 725,000 849,000 430,000 25,000 $394,000 Common Ratios Current Ratio Acid Test (Quick Ratio) Debt to Asset Inventory Turnover Profit Margin Asset Turnover Return on Assets (ROA) Return on Equity (ROE)


