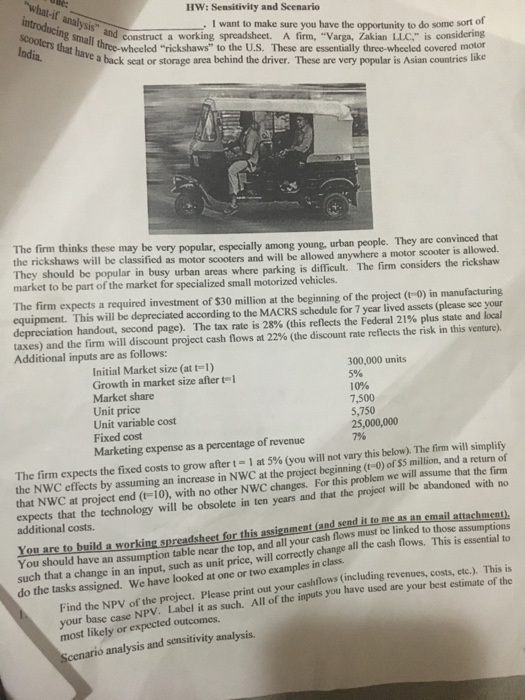
r what-if analysis" and HW: Sensitivity and Scenario . I want to make sure you have the opportunity to do some sort of Small id construct a working spreadsheet. A firm, "Varga, Zakian Lic," is considering heeled "rickshaws" to the U.S. These are essentially three-wheeled covered motor ve a back seat or storage area behind the driver. These are very popular is Asian countries like The firm thinks these may be very popular, especially among young, urban people. They are convinced that the rickshaws will be classified as motor scooters and will be allowed anywhere a m They should be popular in busy urban areas where market to be part of the market for specialized small motorized vehicles. otor scooter is al parking is difficult. The firm considers the rickshaw The firm expects a required investment of $30 million at the beginning of the project (t 0) in manufacturing equipment. This will be depreciated according to the MACRS schedule for 7 year lived assets (please see your depreciation handout, second page). The tax rate is 28% (this reflects the Federal 21% plus state and Ical taxes) and the firm will discount project cash flows at 22% (the discount rate reflects the risk in this venture). Additional inputs are as follows Initial Market size (at t-1) Growth in market size after t l Market share Unit price Unit variable cost Fixed cost Marketing expense as a percentage of revenue 300,000 units 5% 10% 7,500 5,750 25,000,000 7% expects the fixed costs to grow after t 1 at 5% 00u will not vary this below) The fin will simplify the NWC effects by assuming an increase in NWC at the project beginning (t-0) of $5 million, and a return of that NWC at project end (t-10), with no other NWC changes. For this problem we will assume that the firm expects that the technology will be obsolete in ten years and that the project will be abandoned with no You are to build a working spreadsheet for this assignment (and send it to me as an email attachment). assumptions additional costs. You should have an assumption table near the top, and all your cash flows must be linked to those do the tasks assigned. We have looked at one or two examples in class such that a change in an input, such as unit price, will correctly change all the cash flows. This is essential to Find the NPV of the project. Please print out your cashflows (including revenues, costs, etc.). This is your base case NPV. Label it as such. All otheinus you heus r best estimate of the ou most likely or cenario analysis and sensitivity analysis of course you realize that you may be wrong, in fact most likely will be and maximums. Assumptions Initial Market size 200,000 the range of potential outcomes, and eveloped the following assumptions about oa have considerod minimums Minimum Likeliest Maximum 450,000 300,000 Growth rate in market size after t- Market share Unit price Unit variable cost 4,900 Fixed cost Marketing expense (as a percent 5% 10% 7,500 5,750 8% 15% 8,500 6,250 5% 20,000,000 25,000,000 30,000,000 of revenues) 5% 796 10% a. Using the information provided, calculate the NPV of the worst case and best case scemarios I did not use any special software. I just chose the appropriate min or max (from the table above) and entered each in my spreadsheet (in the assumption table). Of course, you may want to use Excel's scenario manager (illustrated in class and on a handout). Please print out (and submit) either your cash flow tables (with NPV indicated) or the "Scenario Summary" if you used Excel's Scenario Manager b. Sensitivity analysis Now do the following: Start with the base case (ie, the original assumptions, labeled as likeliest above). Use the goal seek function in Excel (if you have an alternative way to do this, that is fine) to find the values of each of the imputs that produce a zero NPV. (Do them one at a time, such that in each case the only input you change is the one you are considering.) To remind you, the inputs to consider are: Initial Market size Growth in market size after t- Market share Unit price Unit variable cost Fixed cost Marketing expense as a percentage of revenue For each one, calculate the percentage change from the original estimate that the new value represents. Create a table with four columns: input variable (in the order listed), base value, value of that variable that produces a zero NPV, percentage change in the input that causes the zero NPV. Given vour results, which of the inputs should you pay the most attention to? In other words, which input estimates are most critical to your analysis? To sum hat Iwan: you will provide all the information above in an easy-to-follow manner (that is why in order, labelled, and so on. I have to look at over 60 of these). You will send me your that is in addition to the material you hand in). I will not look at an assignment spreadsheet (but that is dost a spreadsheet or a spreadsheet without the materials handed in. r what-if analysis" and HW: Sensitivity and Scenario . I want to make sure you have the opportunity to do some sort of Small id construct a working spreadsheet. A firm, "Varga, Zakian Lic," is considering heeled "rickshaws" to the U.S. These are essentially three-wheeled covered motor ve a back seat or storage area behind the driver. These are very popular is Asian countries like The firm thinks these may be very popular, especially among young, urban people. They are convinced that the rickshaws will be classified as motor scooters and will be allowed anywhere a m They should be popular in busy urban areas where market to be part of the market for specialized small motorized vehicles. otor scooter is al parking is difficult. The firm considers the rickshaw The firm expects a required investment of $30 million at the beginning of the project (t 0) in manufacturing equipment. This will be depreciated according to the MACRS schedule for 7 year lived assets (please see your depreciation handout, second page). The tax rate is 28% (this reflects the Federal 21% plus state and Ical taxes) and the firm will discount project cash flows at 22% (the discount rate reflects the risk in this venture). Additional inputs are as follows Initial Market size (at t-1) Growth in market size after t l Market share Unit price Unit variable cost Fixed cost Marketing expense as a percentage of revenue 300,000 units 5% 10% 7,500 5,750 25,000,000 7% expects the fixed costs to grow after t 1 at 5% 00u will not vary this below) The fin will simplify the NWC effects by assuming an increase in NWC at the project beginning (t-0) of $5 million, and a return of that NWC at project end (t-10), with no other NWC changes. For this problem we will assume that the firm expects that the technology will be obsolete in ten years and that the project will be abandoned with no You are to build a working spreadsheet for this assignment (and send it to me as an email attachment). assumptions additional costs. You should have an assumption table near the top, and all your cash flows must be linked to those do the tasks assigned. We have looked at one or two examples in class such that a change in an input, such as unit price, will correctly change all the cash flows. This is essential to Find the NPV of the project. Please print out your cashflows (including revenues, costs, etc.). This is your base case NPV. Label it as such. All otheinus you heus r best estimate of the ou most likely or cenario analysis and sensitivity analysis of course you realize that you may be wrong, in fact most likely will be and maximums. Assumptions Initial Market size 200,000 the range of potential outcomes, and eveloped the following assumptions about oa have considerod minimums Minimum Likeliest Maximum 450,000 300,000 Growth rate in market size after t- Market share Unit price Unit variable cost 4,900 Fixed cost Marketing expense (as a percent 5% 10% 7,500 5,750 8% 15% 8,500 6,250 5% 20,000,000 25,000,000 30,000,000 of revenues) 5% 796 10% a. Using the information provided, calculate the NPV of the worst case and best case scemarios I did not use any special software. I just chose the appropriate min or max (from the table above) and entered each in my spreadsheet (in the assumption table). Of course, you may want to use Excel's scenario manager (illustrated in class and on a handout). Please print out (and submit) either your cash flow tables (with NPV indicated) or the "Scenario Summary" if you used Excel's Scenario Manager b. Sensitivity analysis Now do the following: Start with the base case (ie, the original assumptions, labeled as likeliest above). Use the goal seek function in Excel (if you have an alternative way to do this, that is fine) to find the values of each of the imputs that produce a zero NPV. (Do them one at a time, such that in each case the only input you change is the one you are considering.) To remind you, the inputs to consider are: Initial Market size Growth in market size after t- Market share Unit price Unit variable cost Fixed cost Marketing expense as a percentage of revenue For each one, calculate the percentage change from the original estimate that the new value represents. Create a table with four columns: input variable (in the order listed), base value, value of that variable that produces a zero NPV, percentage change in the input that causes the zero NPV. Given vour results, which of the inputs should you pay the most attention to? In other words, which input estimates are most critical to your analysis? To sum hat Iwan: you will provide all the information above in an easy-to-follow manner (that is why in order, labelled, and so on. I have to look at over 60 of these). You will send me your that is in addition to the material you hand in). I will not look at an assignment spreadsheet (but that is dost a spreadsheet or a spreadsheet without the materials handed in