Answered step by step
Verified Expert Solution
Question
1 Approved Answer
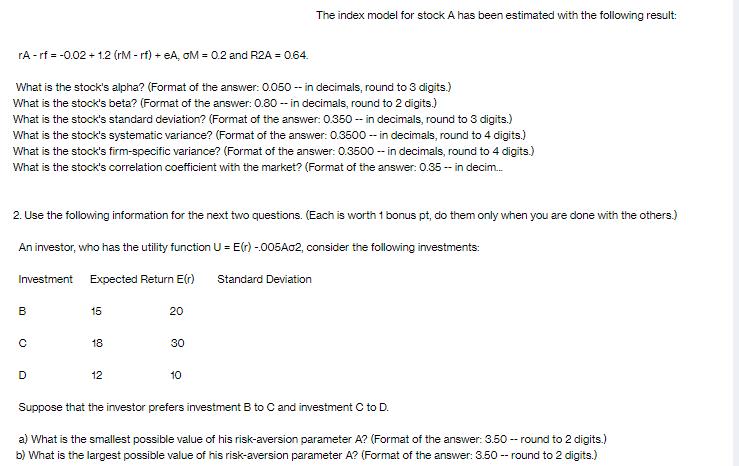
rA -rf = -0.02 + 1.2 (rM - rf) +eA, OM = 0.2 and R2A = 0.64. What is the stock's alpha? (Format of

rA -rf = -0.02 + 1.2 (rM - rf) +eA, OM = 0.2 and R2A = 0.64. What is the stock's alpha? (Format of the answer: 0.050 - in decimals, round to 3 digits.) What is the stock's beta? (Format of the answer: 0.80 -- in decimals, round to 2 digits.) What is the stock's standard deviation? (Format of the answer: 0.350 -- in decimals, round to 3 digits.) What is the stock's systematic variance? (Format of the answer: 0.3500 -- in decimals, round to 4 digits.) What is the stock's firm-specific variance? (Format of the answer: 0.3500 -- in decimals, round to 4 digits.) What is the stock's correlation coefficient with the market? (Format of the answer: 0.35 -- in decim... 2. Use the following information for the next two questions. (Each is worth 1 bonus pt, do them only when you are done with the others.) An investor, who has the utility function U = E(r) -.005A02, consider the following investments: Expected Return E(r) Standard Deviation Investment B C D 15 18 12 20 The index model for stock A has been estimated with the following result: 30 10 Suppose that the investor prefers investment B to C and investment C to D. a) What is the smallest possible value of his risk-aversion parameter A? (Format of the answer: 3.50-round to 2 digits.) b) What is the largest possible value of his risk-aversion parameter A? (Format of the answer: 3.50--round to 2 digits.)
Step by Step Solution
★★★★★
3.31 Rating (154 Votes )
There are 3 Steps involved in it
Step: 1
To solve the first part of your question lets break down the given information rA rf 002 12rM rf eA OM 02 R2A 064 Heres how we can calculate the stocks alpha beta standard deviation systematic variance firmspecific variance and correlation coefficient with the market 1 Alpha The alpha represents the excess return of the stock ...
Get Instant Access to Expert-Tailored Solutions
See step-by-step solutions with expert insights and AI powered tools for academic success
Step: 2

Step: 3

Ace Your Homework with AI
Get the answers you need in no time with our AI-driven, step-by-step assistance
Get Started


