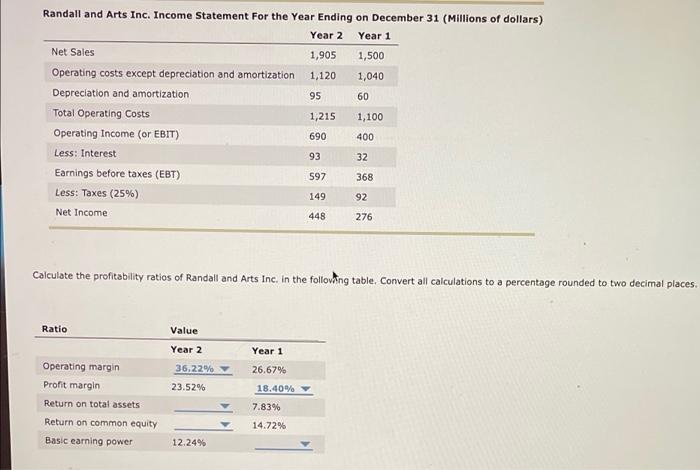
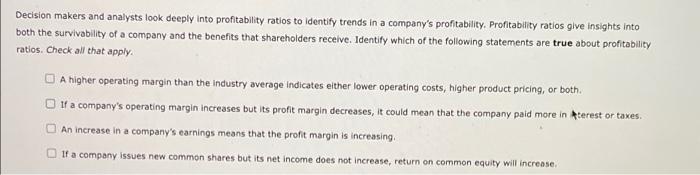
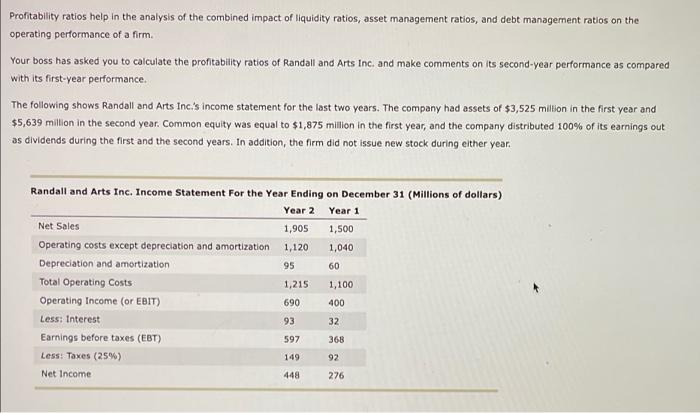
Randall and Arts Inc. Income Statement For the Year Ending on December 31 (Millions of dollars) Year 2 Year 1 Net Sales 1,905 1,500 Operating costs except depreciation and amortization 1,120 1,040 Depreciation and amortization 95 60 Total Operating Costs 1,215 1,100 Operating Income (or EBIT) 690 400 Less: Interest 93 32 Earnings before taxes (EBT) 597 368 Less: Taxes (25%) 149 92 Net Income. 448 276 Calculate the profitability ratios of Randall and Arts Inc. in the following table. Convert all calculations to a percentage rounded to two decimal places. Ratio Value Year 2 Year 1 Operating margin 26.67% Profit margin Return on total assets Return on common equity Basic earning power 36.22% 23.52% 12.24% 18.40% 7.83% 14.72% Decision makers and analysts look deeply into profitability ratios to identify trends in a company's profitability. Profitability ratios give insights into both the survivability of a company and the benefits that shareholders receive. Identify which of the following statements are true about profitability ratios. Check all that apply. A higher operating margin than the industry average indicates either lower operating costs, higher product pricing, or both. If a company's operating margin increases but its profit margin decreases, it could mean that the company paid more interest or taxes. An increase in a company's earnings means that the profit margin is increasing. If a company issues new common shares but its net income does not increase, return on common equity will increase. Profitability ratios help in the analysis of the combined impact of liquidity ratios, asset management ratios, and debt management ratios on the operating performance of a firm. Your boss has asked you to calculate the profitability ratios of Randall and Arts Inc. and make comments on its second-year performance as compared with its first-year performance. The following shows Randall and Arts Inc.'s income statement for the last two years. The company had assets of $3,525 million in the first year and $5,639 million in the second year. Common equity was equal to $1,875 million in the first year, and the company distributed 100 % of its earnings out as dividends during the first and the second years. In addition, the firm did not issue new stock during either year. Randall and Arts Inc. Income Statement For the Year Ending on December 31 (Millions of dollars) Year 2 Year 1 Net Sales 1,905 1,500 Operating costs except depreciation and amortization 1,120 1,040 Depreciation and amortization 95 60 Total Operating Costs 1,215 1,100 Operating Income (or EBIT) 690 400 Less: Interest 93 32 Earnings before taxes (EBT) 597 368 Less: Taxes (25%) 149 92 Net Income 448 276