Answered step by step
Verified Expert Solution
Link Copied!

Question

1 Approved Answer

Randall and Arts Inc. Income Statement For the Year Ending on December 31 (Millions of dollars) Year 2 Year 1 Net Sales 5,715 4,500 Operating
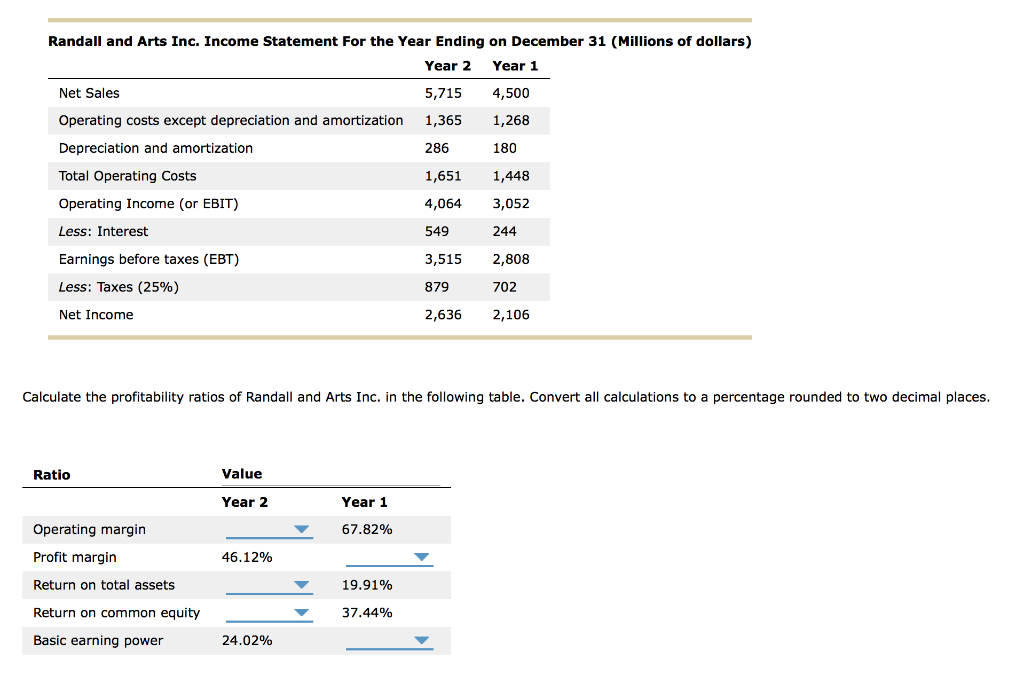
image text in transcribed

Randall and Arts Inc. Income Statement For the Year Ending on December 31 (Millions of dollars) Year 2 Year 1 Net Sales 5,715 4,500 Operating costs except depreciation and amortization 1,365 1,268 Depreciation and amortization 286 180 Total Operating Costs 1,651 1,448 Operating Income (or EBIT) 4,064 3,052 Less: Interest 549244 Earnings before taxes (EBT) 3,515 2,808 Less: Taxes (25%) 879702 Net Income 2,636 2,106 Calculate the profitability ratios of Randall and Arts Inc. in the following table. Convert all calculations to a percentage rounded to two decimal places. Ratio Value Year 2 Year 1 67.82% Operating margin Profit margin 46.12% Return on total assets 19.91% 37.44% Return on common equity Basic earning power 24.02%

Step by Step Solution

There are 3 Steps involved in it

Step: 1

blur-text-image

Get Instant Access to Expert-Tailored Solutions

See step-by-step solutions with expert insights and AI powered tools for academic success

Step: 2

blur-text-image

Step: 3

blur-text-image

Ace Your Homework with AI

Get the answers you need in no time with our AI-driven, step-by-step assistance

Get Started

Recommended Textbook for

They See Me Closin They Hatin

Authors: Be Mi Real Estate Store

1st Edition

B0BW2ZSLY1

More Books

Students also viewed these Finance questions

Question

Define Administration and Management

Answered: 1 week ago

Question

Define organisational structure

Answered: 1 week ago

Question

Define line and staff authority

Answered: 1 week ago

Question

What other visualizations might you use to explore sales revenue?

Answered: 1 week ago