Question
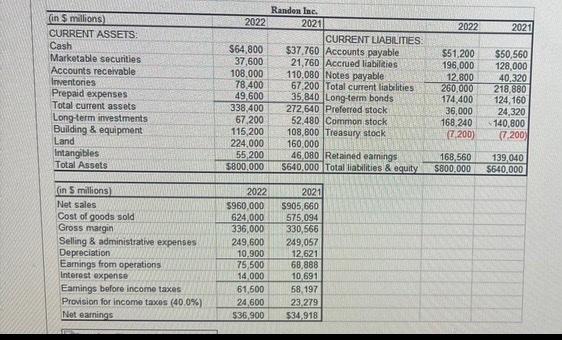
Randon Inc' 2022 pro forma and 2021 actual balance sheets and income statements are as shown. Analysts project that the company's free cash flows follows,
Randon Inc' 2022 pro forma and 2021 actual balance sheets and income statements are as shown. Analysts project that the company's free cash flows follows, and that after 2026 FCFs are expected to grow at a constant 7.3% annually. Randon Inc. WACC is 12.6%. End of Year 2022 FCF 2023 2024 2025 2026 answer a -$9,500M $880M $4,200M $11,300M 1. Calculate the 2022 estimated free cash flow for Randon Inc. 2. Calculate the 2026 horizon value for Randon Inc. 3. Calculate the value of operation for Randon Inc, at the end of year 2021 (i.e. at year 0). 4. Calculate the value of firm for Randon Inc. at the end of year 2021. 5. Suppose Randon Inc. has 3 million shares of common stock outstanding. Calculate the estimated intrinsic value per share for their common stock.

Step by Step Solution
There are 3 Steps involved in it
Step: 1

Get Instant Access to Expert-Tailored Solutions
See step-by-step solutions with expert insights and AI powered tools for academic success
Step: 2

Step: 3

Ace Your Homework with AI
Get the answers you need in no time with our AI-driven, step-by-step assistance
Get Started


