Answered step by step
Verified Expert Solution
Question
1 Approved Answer
Rapid Bus is a commuter bus company. On regional route A, Rapid Bus currently charges $10 per passenger (fare). Monthly revenue for this route is
Rapid Bus is a commuter bus company. On regional route A, Rapid Bus currently charges $10 per passenger (fare). Monthly revenue for this route is $210,000. Currently variable cost is $5 per passenger and fixed cost is $65,000 per month. (complete the calculations for a month)
Required:
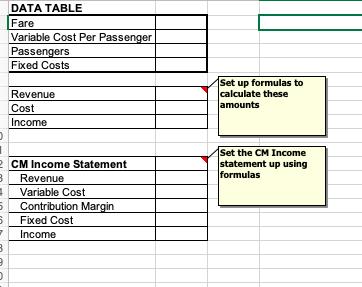
- 1. Enter this information into the “Data Table” in your Excel3Template (Hint you will need to calculate the number of passengers).
- 2. Set up formulas to calculate, Revenue, Cost, & Income
- 3. Use formulas to complete the contribution margin income statement.
- 4. Use scenario manager to save this original data that you added to the Data Table. [name this scenario: Original] Hint: only save the four variables in the data table. If you put a formula in any of these cells, allow scenario manager to change these values to constants.
- 5. Use Goal Seek to find out how many passengers are necessary to breakeven. (Hint: you will need to set income to 0)
- 6. Use scenario manager to save this breakeven information [name this scenario: BE Original] *note if passengers are not whole round up in all scenarios
- 7. Evaluate the following changes and report their affects on income. (Each scenario is independent, so return to the original scenario before making changes)
- a. Fare decreases to $9, but passengers increase by 10% (use scenario manager to save this as: Scenario One)
- b. Fixed cost decrease by $15,000 and the variable rate per passenger increases to $5.50 (use scenario manager to save this as: Scenario Two)
- c. Fixed cost increases by $15,000 and the variable rate per passenger decreases to $3.50 (use scenario manager to save this as: Scenario Three)
- 8. Use goal seek to find out how many passengers are necessary to breakeven under scenario two (use scenario manager to save this as: BE Scenario Two )
- 9. Use goal seek to find out how many passengers are necessary to breakeven under scenario three (use scenario manager to save this as: BE Scenario Three)
- 10.Evaluate passenger rates on scenario two;
- a. Using scenario two change passengers to 30,000 (use scenario manager to save this as: 30,000 Scenario Two)
- b. Using scenario two change passengers to 10,000 (use scenario manager to save this as: 10,000 Scenario Two)
- 11.Evaluate passenger rates on scenario three;
- a. Using scenario three change passengers to 30,000 (use scenario manager to save this as: 30,000 Scenario Three)
- b. Using scenario Three change passengers to 10,000 (use scenario manager to save this as: 10,000 Scenario Three)
- 12.Create scenario summary, include revenue, cost, and income in the results (set result cells as the cells that contain this information)
- 13. Set up the scenario summary table to print on one page.
- 14. Create a table (using the data in the scenario summary table) that highlights the tradeoffs between fixed and variable cost (cost structure). Hint: you will need to use the passenger combinations of scenario two and three. Note you do not need to create a pivot table or a data table, just a simple table that illustrates the tradeoffs.
- 15. Save your Excel file in a manner that contains your name (example: Excel3_lmpleis.xls)
- 16. Submit your Excel file through Blackboard

0 1 DATA TABLE Fare Variable Cost Per Passenger Passengers Fixed Costs Revenue Cost Income 2 CM Income Statement 3 Revenue = Variable Cost 3 9 D 5 Contribution Margin 6 Fixed Cost Income Set up formulas to calculate these amounts Set the CM Income statement up using formulas
Step by Step Solution
There are 3 Steps involved in it
Step: 1
Data Table Fare Variable Cost Per Passenger Passengers Fixed Costs Revenue Cost Income 10 5 21000 65000 210000 115000 95000 Contribution Margin Income ...
Get Instant Access to Expert-Tailored Solutions
See step-by-step solutions with expert insights and AI powered tools for academic success
Step: 2

Step: 3

Ace Your Homework with AI
Get the answers you need in no time with our AI-driven, step-by-step assistance
Get Started


