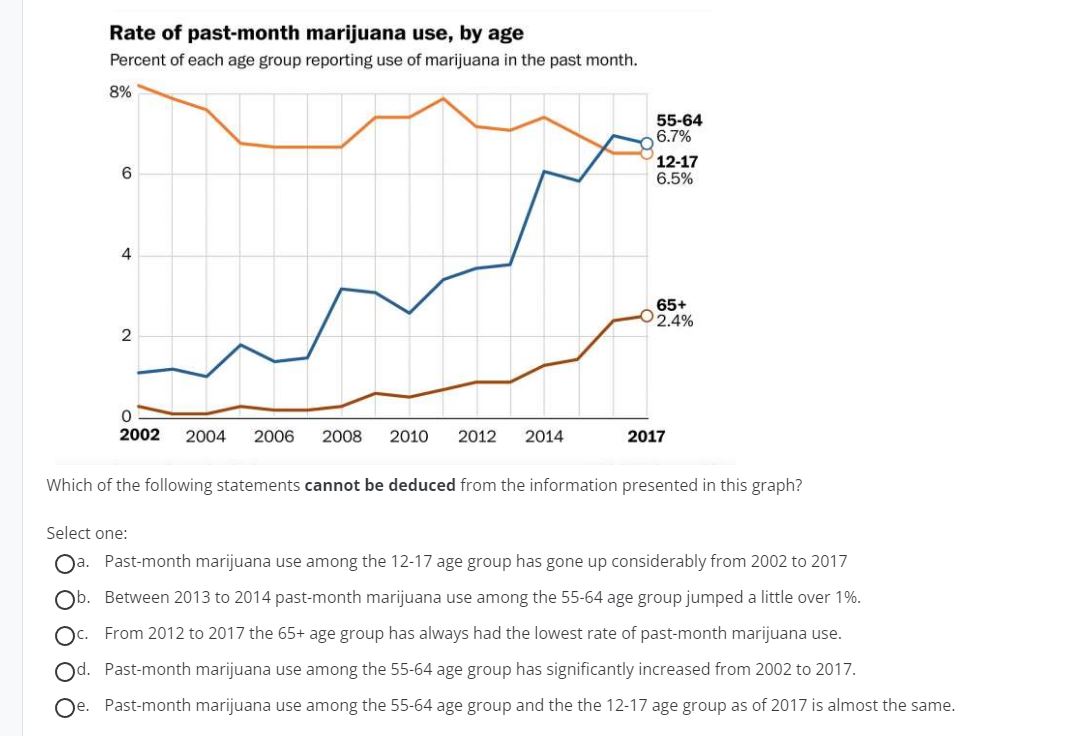
Rate of past-month marijuana use. by age Percent of each age group reporting use of marijuana in the past month. 3% 5504 6.7% 12-17 5
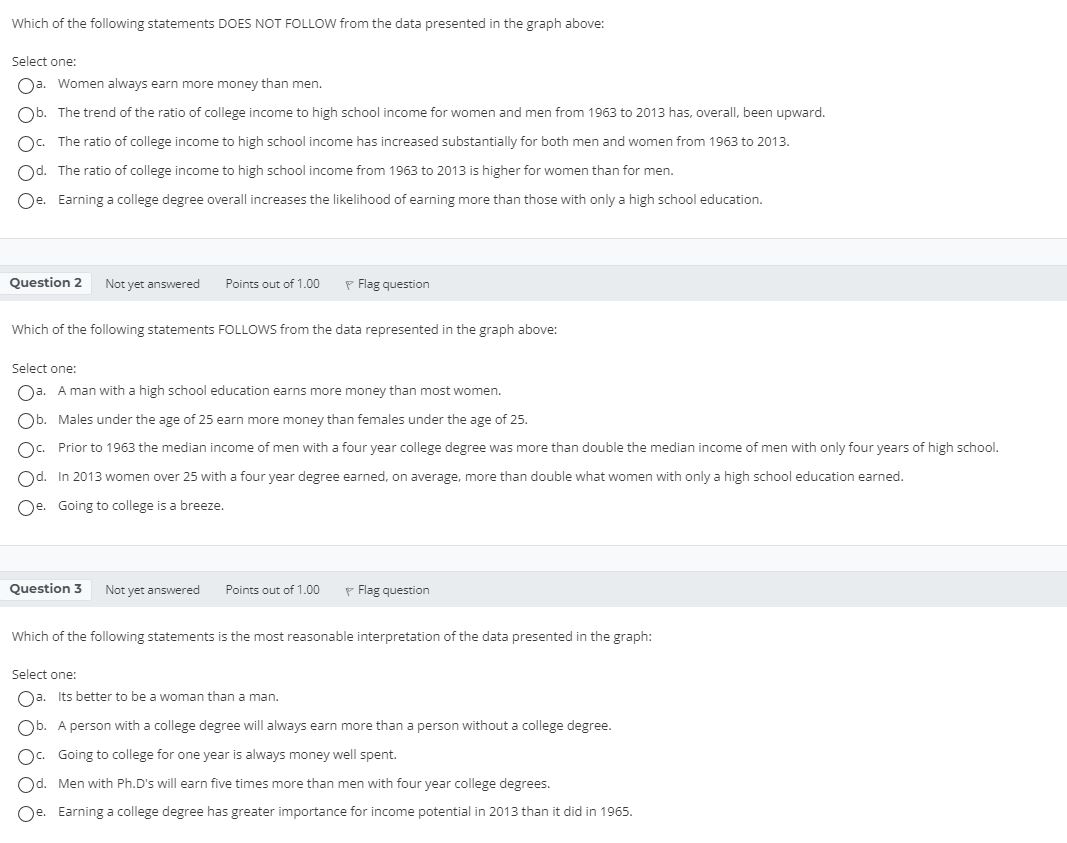
Rate of past-month marijuana use. by age Percent of each age group reporting use of marijuana in the past month. 3% 5504 6.7% 12-17 5 6.5% 4 55+ 24% 2 0 2002 2004 2000 2008 2010 2012 2014 2017 Which of the following statements cannot be deduced from the information presented in this graph? Select one: Oa. Pastmonth marijuana use among the 1 2-17 age group has gone up considerably from 2002 to 2017 Oh. Between 201 3 to 2014 pastmonth marijuana use among the 5564 age groupjumped a little over 1%. Oc. From 2012 to 20171he 65+ age group has always had the lowest rate of pastmonth marijuana use. Ocl. Pastmonth marijuana use among the 5564 age group has signicantly increased from 2002 to 2017. De. Pastmonth marijuana use among the 55-64 age group and the the 12-17 age group as of 2017 is almost the same. Which of the following statements DOES NOT FOLLOW from the data presented in the graph above: Select one: Oa. Women always earn more money than men. Ob. The trend of the ratio of college income to high school income for women and men from1963 to 2013 has. overall, been upward. 0c. The ratio of college income to high school income has increased substantially for both men and women from 1953 to 2013. 0d. The ratio of college income to high school income from 1963 to 2013 is higher for women than for men. 0e. Earning a college degree overall increases the likelihood of earning more than those with only a high school education. Question 2 Not yet answered Points out of 1 .00 if\" Flag question Which of the following statements FOLLOWS from the data represented in the graph above: Select one: 0a. A man with a high school education earns more moneythan most women. Ob. Males under the age of25 earn more money than females under the age of 25. 0c. Prior to 1953 the median income of men with a four year college degree was more than double the median income of men with only four years of high school. Od. In 2013 women over 25 with a fouryear degree earned. on average. more than double what women with only a high school education earned. Oe. Going to college is a breeze. Questio n 3 Not yet answered Pains out of 1.00 2? Flag question Which of the following statements is the most reasonable interpretation ofthe data presented in the graph: Select one: Oa. Its better to be a woman than a man. Ob. A person with a college degree will always earn more than a person without a college degree. Oc. Going to college for one year is always money well spent. Od. Men with Ph.D's will earn five times more than men with four year college degrees. Oe. Earning a college degree has greater importance for income potential in 2013 than it did in 1955. Consider the following graph (there are THREE QUESTIONS below addressing the graph): Figure 3-26 College Income Premium by Gender, 19632013 Ratio of College Income to High School Income 2.50 2013 2-25 Wumcn 2 .00 I .75 Men 1 .50 1.25 1,00 I960 I965 I970 I975 I980 I985 I990 I995 2000 2005 2010 Note: Income premia calculated using median annual income of persons 15 and older. Prior to l99| ."high school graduales" refers to respondents with 4 years of high school1 and \"college graduates" refers 10 respondents with at least 4 years of college. Source: Bureau of labor Statistics. Current Population Survey (Annual Social and Economic Supplement); CEA calculations
Step by Step Solution
There are 3 Steps involved in it
Step: 1
Get Instant Access to Expert-Tailored Solutions
See step-by-step solutions with expert insights and AI powered tools for academic success
Step: 2
Step: 3
Ace Your Homework with AI
Get the answers you need in no time with our AI-driven, step-by-step assistance