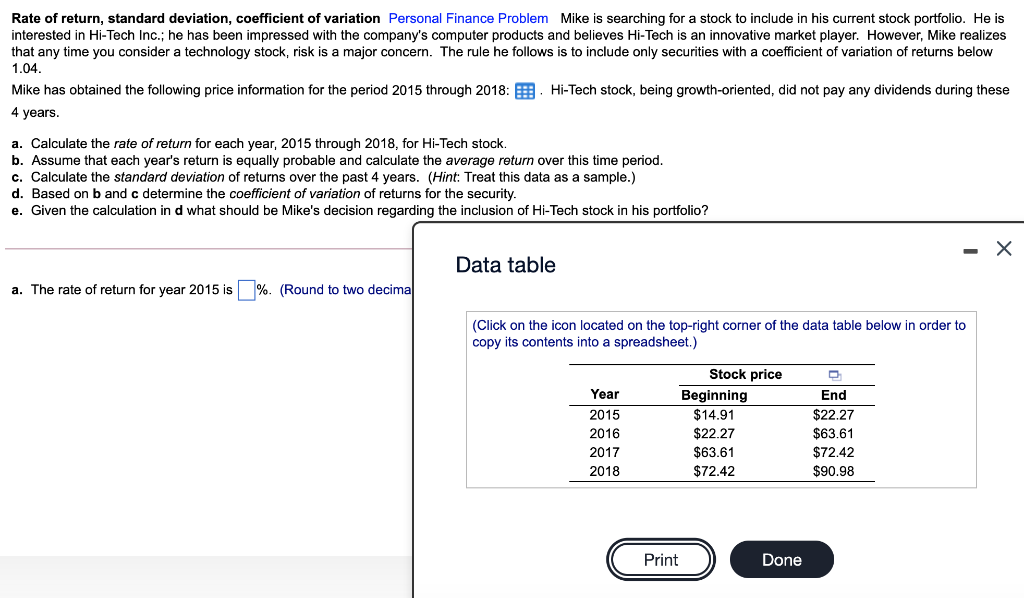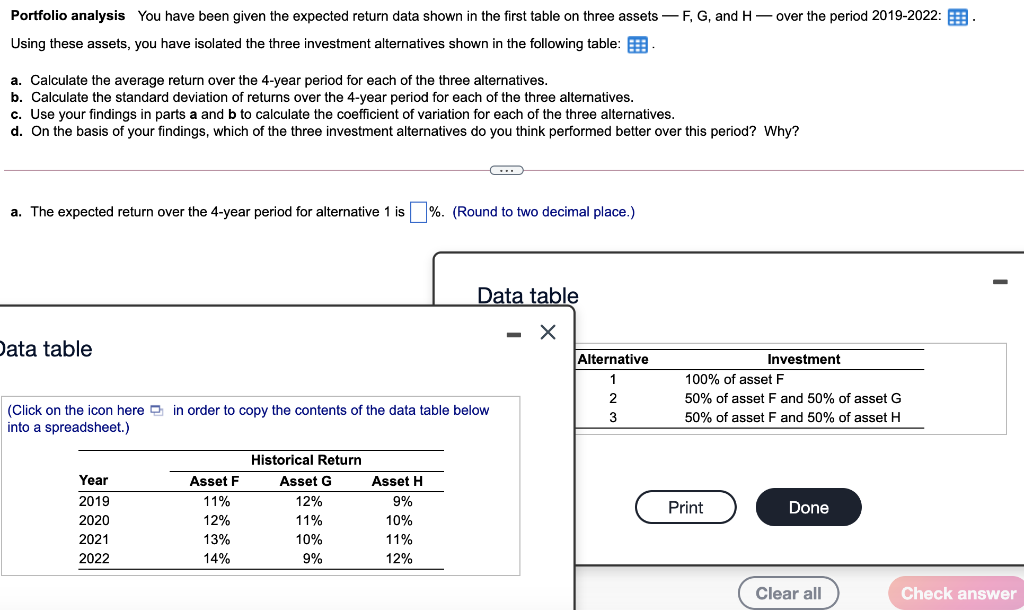

Rate of return, standard deviation, coefficient of variation Personal Finance Problem Mike is searching for a stock to include in his current stock portfolio. He is interested in Hi-Tech Inc.; he has been impressed with the company's computer products and believes Hi-Tech is an innovative market player. However, Mike realizes that any time you consider a technology stock, risk is major concern. The rule he follows is to include only securities with a coefficient of variation of returns below 1.04. Mike has obtained the following price information for the period 2015 through 2018: Hi-Tech stock, being growth-oriented, did not pay any dividends during these 4 years. a. Calculate the rate of return for each year, 2015 through 2018, for Hi-Tech stock. b. Assume that each year's return is equally probable and calculate the average return over this time period. c. Calculate the standard deviation of returns over the past 4 years. (Hint: Treat this data as a sample.) d. Based on b and c determine the coefficient of variation of returns for the security. e. Given the calculation in d what should be Mike's decision regarding the inclusion of Hi-Tech stock in his portfolio? Data table a. The rate of return for year 2015 is %. (Round to two decima (Click on the icon located on the top-right corner of the data table below in order to copy its contents into a spreadsheet.) Year 2015 2016 2017 2018 Stock price Beginning $14.91 $22.27 $63.61 $72.42 End $22.27 $63.61 $72.42 $90.98 Print Done Portfolio analysis You have been given the expected return data shown in the first table on three assets F, G, and H- over the period 2019-2022: E: Using these assets, you have isolated the three investment alternatives shown in the following table: a. Calculate the average return over the 4-year period for each of the three alternatives. b. Calculate the standard deviation of returns over the 4-year period for each of the three alternatives. c. Use your findings in parts and b to calculate the coefficient of variation for each of the three alternatives. d. On the basis of your findings, which of the three investment alternatives do you think performed better over this period? Why? C. a. The expected return over the 4-year period for alternative 1 is %. (Round to two decimal place.) - Data table - Data table Alternative 1 2 3 Investment 100% of asset F 50% of asset F and 50% of asset G 50% of asset F and 50% of asset H (Click on the icon here in order to copy the contents of the data table below into a spreadsheet.) Historical Return Asset G Year 2019 12% Print Done 2020 2021 2022 Asset F 11% 12% 13% 14% 11% 10% 9% Asset H 9% 10% 11% 12% Clear all Check


