

Question
Ratio Analysis 2014 2015 2016E Industry Average Current 2.3 1.5 2.7 Quick 0.8 0.5 1.0 Inventory turnover 4.0 4.0 6.1 Days sales outstanding 37.4 days
| Ratio Analysis | 2014 | 2015 | 2016E | Industry Average |
|---|---|---|---|---|
| Current | 2.3 | 1.5 | 2.7 | |
| Quick | 0.8 | 0.5 | 1.0 | |
| Inventory turnover | 4.0 | 4.0 | 6.1 | |
| Days sales outstanding | 37.4 days | 39.6 days | 32.0 days | |
| Fixed assets turnover | 10.0 | 6.2 | 7.0 | |
| Total assets turnover | 2.3 | 2.0 | 2.5 | |
| Debt ratio | 35.6% | 59.6% | 32.0% | |
| TIE | 3.3 | 0.1 | 6.2 | |
| EBITDA coverage | 2.6 | 0.8 | 8.0 | |
| Profit margin | 2.6% | 1.6% | 3.6% | |
| Basic earning power | 14.2% | 0.6% | 17.8% | |
| ROA | 6.0% | 3.3% | 9.0% | |
| ROE | 13.3% | 17.1% | 17.9% | |
| Price/earnings (P/E) | 9.7 | N.M. | 16.2 | |
| Price/cash flow | 8.0 | 27.5 | 7.6 | |
| Market/book | 1.3 | 1.1 | 2.9 |
-
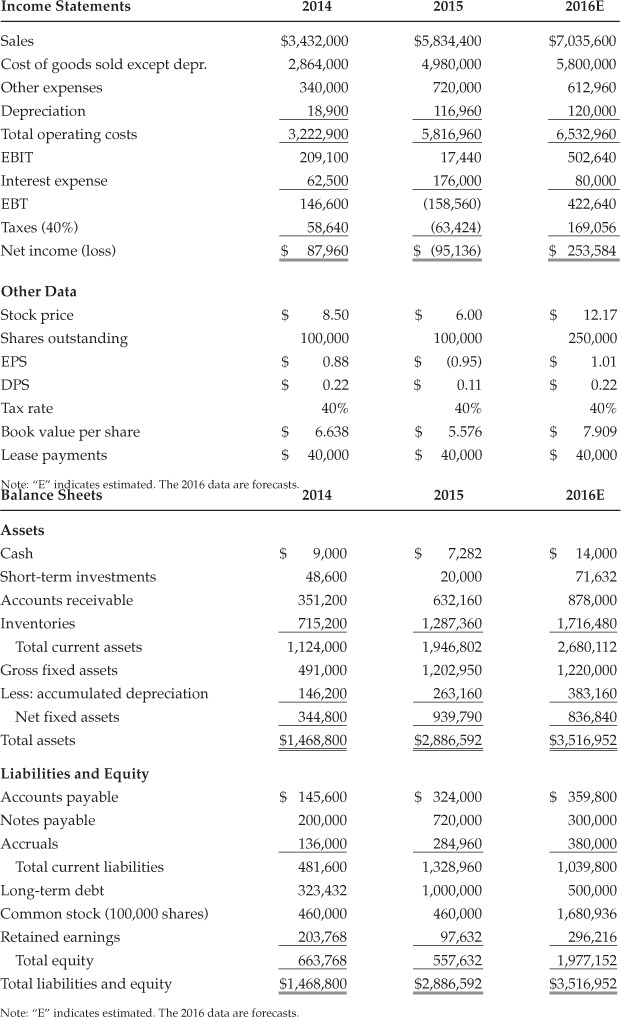
Calculate the 2016 inventory turnover, days sales outstanding (DSO), fixed assets turnover, and total assets turnover. How does Computron's utilization of assets stack up against that of other firms in its industry?
-
Calculate the 2016 debt, times-interest-earned, and EBITDA coverage ratios. How does Computron compare with the industry with respect to financial leverage? What can you conclude from these ratios?
-
Calculate the 2016 profit margin, basic earning power (BEP), return on assets (ROA), and return on equity (ROE). What can you say about these ratios?
Step by Step Solution
There are 3 Steps involved in it
Step: 1

Get Instant Access to Expert-Tailored Solutions
See step-by-step solutions with expert insights and AI powered tools for academic success
Step: 2

Step: 3
Ace Your Homework with AI
Get the answers you need in no time with our AI-driven, step-by-step assistance
Get Started
Applications In Energy Finance
Authors: Christos Floros, Ioannis Chatziantoniou
1st Edition
3030929566, 978-3030929565