Ratio Analysis
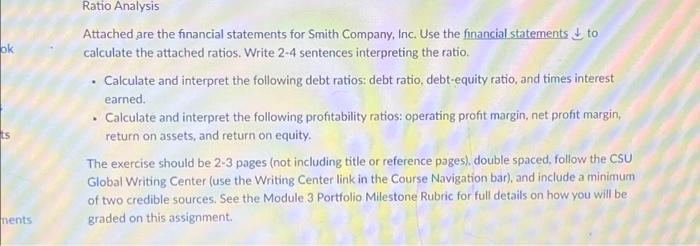
Attached are the financial statements for Smith Company, Inc. Use the financial statements to calculate the attached ratios. Write 2-4 sentences interpreting the ratio.
1. Calculate and interpret the following debt ratios: debt ratio, debt-equity ratio, and times interest earned.
2. Calculate and interpret the following profitability ratios: operating profit margin, net profit margin, return on assets, and return on equity.
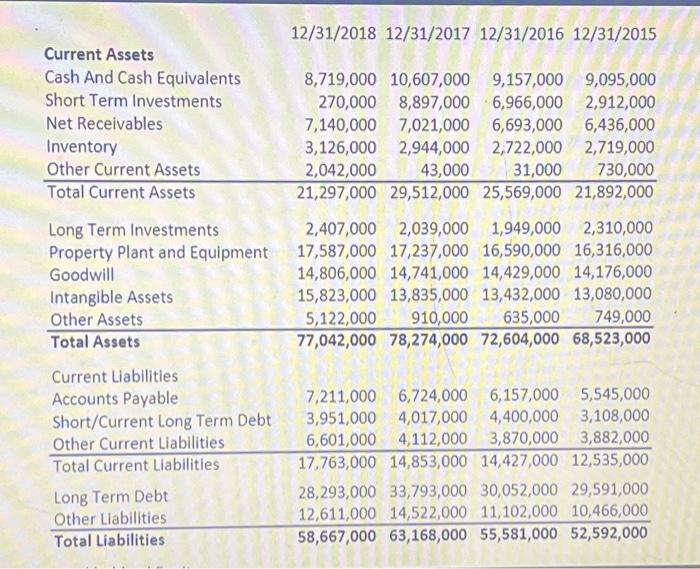
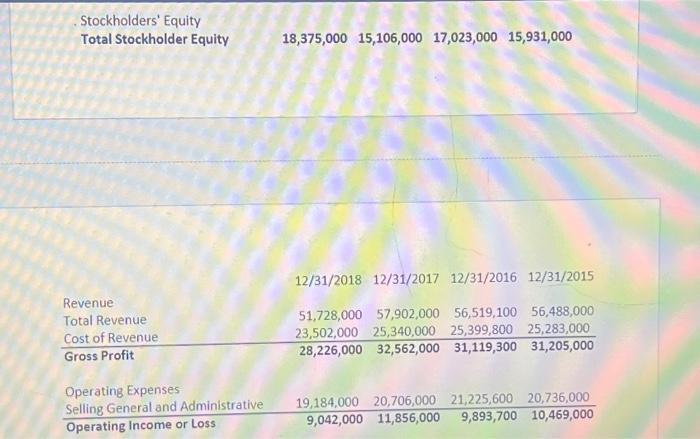
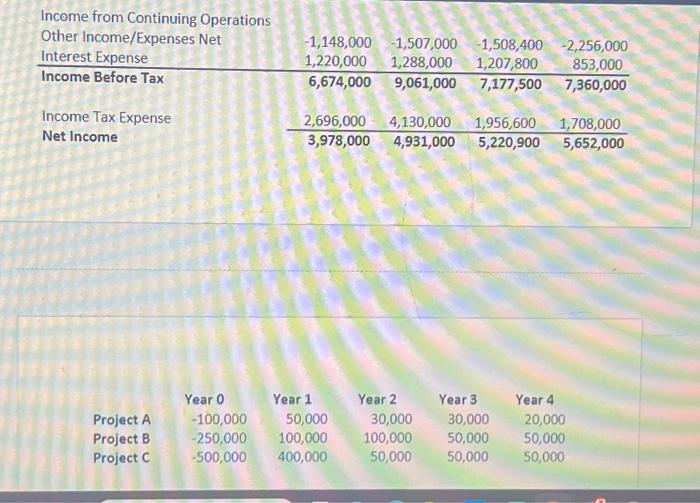
Attached are the financial statements for Smith Company, Inc. Use the financial statements \\( \\downarrow \\) to calculate the attached ratios. Write 2-4 sentences interpreting the ratio. - Calculate and interpret the following debt ratios: debt ratio, debt-equity ratio, and times interest earned. - Calculate and interpret the following profitability ratios: operating profit margin, net profit margin, return on assets, and return on equity. The exercise should be 2-3 pages (not including title or reference pages), double spaced, follow the CSU Global Writing Center (use the Writing Center link in the Course Navigation bar), and include a minimum of two credible sources. See the Module 3 Portfolio Milestone Rubric for full details on how you will be graded on this assignment. Income from Continuing Operations \\begin{tabular}{lcccc} Other Income/Expenses Net & \\( -1,148,000 \\) & \\( -1,507,000 \\) & \\( -1,508,400 \\) & \\( -2,256,000 \\) \\\\ Interest Expense & \\( 1,220,000 \\) & \\( 1,288,000 \\) & \\( 1,207,800 \\) & 853,000 \\\\ \\hline Income Before Tax & \\( 6,674,000 \\) & \\( 9,061,000 \\) & \\( 7,177,500 \\) & \\( 7,360,000 \\) \\\\ & \\( 2,696,000 \\) & \\( 4,130,000 \\) & \\( 1,956,600 \\) & \\( 1,708,000 \\) \\\\ \\hline Income Tax Expense & \\( 3,978,000 \\) & \\( 4,931,000 \\) & \\( 5,220,900 \\) & \\( 5,652,000 \\) \\end{tabular} \\begin{tabular}{lccrcc} & Year 0 & \\multicolumn{1}{c}{ Year 1 } & \\multicolumn{1}{c}{ Year 2 } & Year 3 & Year 4 \\\\ Project A & \\( -100,000 \\) & 50,000 & 30,000 & 30,000 & 20,000 \\\\ Project B & \\( -250,000 \\) & 100,000 & 100,000 & 50,000 & 50,000 \\\\ Project C & \\( -500,000 \\) & 400,000 & 50,000 & 50,000 & 50,000 \\end{tabular} \\( 12 / 31 / 2018 \\quad 12 / 31 / 2017 \\quad 12 / 31 / 2016 \\quad 12 / 31 / 2015 \\) \\begin{tabular}{lrrrr} Current Assets & & & & \\\\ Cash And Cash Equivalents & \\( 8,719,000 \\) & \\( 10,607,000 \\) & \\( 9,157,000 \\) & \\( 9,095,000 \\) \\\\ Short Term Investments & 270,000 & \\( 8,897,000 \\) & \\( 6,966,000 \\) & \\( 2,912,000 \\) \\\\ Net Receivables & \\( 7,140,000 \\) & \\( 7,021,000 \\) & \\( 6,693,000 \\) & \\( 6,436,000 \\) \\\\ Inventory & \\( 3,126,000 \\) & \\( 2,944,000 \\) & \\( 2,722,000 \\) & \\( 2,719,000 \\) \\\\ Other Current Assets & \\( 2,042,000 \\) & 43,000 & 31,000 & 730,000 \\\\ \\hline Total Current Assets & \\( 21,297,000 \\) & \\( 29,512,000 \\) & \\( 25,569,000 \\) & \\( 21,892,000 \\) \\\\ & \\( 2,407,000 \\) & \\( 2,039,000 \\) & \\( 1,949,000 \\) & \\( 2,310,000 \\) \\\\ Long Term Investments & \\( 17,587,000 \\) & \\( 17,237,000 \\) & \\( 16,590,000 \\) & \\( 16,316,000 \\) \\\\ Property Plant and Equipment & \\( 14,806,000 \\) & \\( 14,741,000 \\) & \\( 14,429,000 \\) & \\( 14,176,000 \\) \\\\ Goodwill & \\( 15,823,000 \\) & \\( 13,835,000 \\) & \\( 13,432,000 \\) & \\( 13,080,000 \\) \\\\ Intanglble Assets & \\( 5,122,000 \\) & 910,000 & 635,000 & 749,000 \\\\ \\hline Other Assets & \\( 77,042,000 \\) & \\( 78,274,000 \\) & \\( 72,604,000 \\) & \\( 68,523,000 \\) \\end{tabular} \\begin{tabular}{lrrrr} Current Liabilities & & & & \\\\ Accounts Payable & \\( 7,211,000 \\) & \\( 6,724,000 \\) & \\( 6,157,000 \\) & \\( 5,545,000 \\) \\\\ Short/Current Long Term Debt & \\( 3,951,000 \\) & \\( 4,017,000 \\) & \\( 4,400,000 \\) & \\( 3,108,000 \\) \\\\ Other Current Liabilities & \\( 6,601,000 \\) & \\( 4,112,000 \\) & \\( 3,870,000 \\) & \\( 3,882,000 \\) \\\\ \\hline Total Current Liabilities & \\( 17,763,000 \\) & \\( 14,853,000 \\) & \\( 14,427,000 \\) & \\( 12,535,000 \\) \\\\ Long Term Debt & \\( 28,293,000 \\) & \\( 33,793,000 \\) & \\( 30,052,000 \\) & \\( 29,591,000 \\) \\\\ Other Liabilities & \\( 12,611,000 \\) & \\( 14,522,000 \\) & \\( 11,102,000 \\) & \\( 10,466,000 \\) \\\\ \\hline Total Liabilities & \\( 58,667,000 \\) & \\( 63,168,000 \\) & \\( 55,581,000 \\) & \\( \\mathbf{5 2 , 5 9 2 , 0 0 0} \\) \\end{tabular} Stockholders' Equity Total Stockholder Equity \\[ \\begin{array}{llll} 18,375,000 & 15,106,000 \\quad 17,023,000 \\quad 15,931,000 \\end{array} \\] 12/31/2018 12/31/2017 12/31/2016 12/31/2015 \\begin{tabular}{lcccc} Revenue & \\( 51,728,000 \\) & \\( 57,902,000 \\) & \\( 56,519,100 \\) & \\( 56,488,000 \\) \\\\ Total Revenue & \\( 23,502,000 \\) & \\( 25,340,000 \\) & \\( 25,399,800 \\) & \\( 25,283,000 \\) \\\\ \\hline Cost of Revenue & \\( \\mathbf{2 8 , 2 2 6 , 0 0 0} \\) & \\( \\mathbf{3 2 , 5 6 2 , 0 0 0} \\) & \\( \\mathbf{3 1 , 1 1 9 , 3 0 0} \\) & \\( \\mathbf{3 1 , 2 0 5 , 0 0 0} \\) \\end{tabular} Operating Expenses \\begin{tabular}{lrrrr} Opelling General and Administrative & \\( 19,184,000 \\) & \\( 20,706,000 \\) & \\( 21,225,600 \\) & \\( 20,736,000 \\) \\\\ \\hline Operating Income or Loss & \\( 9,042,000 \\) & \\( 11,856,000 \\) & \\( 9,893,700 \\) & \\( 10,469,000 \\) \\end{tabular}


