Ratio analysis of financial performance and financial position of JBHIFI company in fiscal year 2021
1. Report on three financial performance and efficiency ratios 2. Report three financial position ratios (financial structure and liquidity) 3. Annual data by June 31, 2021, or why they decided not to do it 4. Typical explanation and integration of the company's financial situation, including reference to loan decision-making.
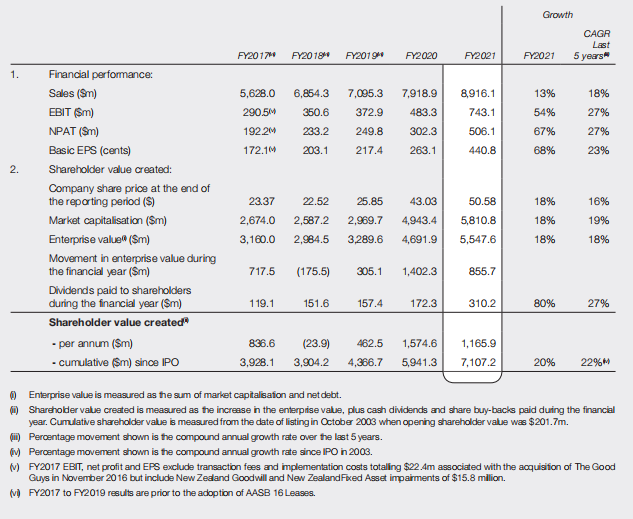
Growth CAGR Last 5 years FY2017 FY2019 FY2019 FY2020 FY2021 FY2021 1. 5,628.0 6,864.3 350.6 233.2 7,095.3 372.9 249.8 7,918.9 483.3 290.5M 192.2M 8,916.1 743.1 506.1 13% 54% 67% 18% 27% 302.3 27% 172.1M 203.1 217.4 263.1 440.8 68% 23% 2. 43.03 18% Financial performance: Sales (Sm) EBIT (SM) NPAT (S) Basic EPS (cents) Shareholder value created: Company share price at the end of the reporting period ($) Market capitalisation (m) Enterprise value ($m) Movement in enterprise value during the financial year ($m) Dividends paid to shareholders during the financial year (Sm) Shareholder value created - per annum ($m) - cumulative ($m) since IPO 23.37 2,674.0 3,160.0 22.52 2,587.2 2,984.5 25.85 2,969.7 3,289.6 50.58 5,810.8 16% 19% 18% 4,943.4 4,691.9 5,547.6 18% 18% 717.5 (175.5) 305.1 1,402.3 855.7 119.1 151.6 157.4 172.3 310.2 80% 27% 462.5 836.6 3.928.1 (23.9) 3,904.2 1,574.6 5,941.3 1,165.9 7,107.2 4.366.7 20% 22% Enterprise value is measured as the sum of market capitalisation and net debt. Shareholder value created is measured as the increase in the enterprise value, plus cash dividends and share buy-backs paid during the financial year. Cumulative shareholder value is measured from the date of listing in October 2003 when opening shareholder value was $201.7m. (H) Percentage movement shown is the compound annual growth rate over the last 5 years. W Percentage movement shown is the compound annual growth rate since IPO in 2003. V FY2017 EBIT, net profit and EPS exclude transaction fees and implementation costs totaling $22.4m associated with the acquisition of The Good Guys in November 2016 but include New Zealand Goodwill and New Zealand Fixed Asset impairments of $15.8 million. MFY2017 to FY2019 results are prior to the adoption of AASB 16 Leases. Growth CAGR Last 5 years FY2017 FY2019 FY2019 FY2020 FY2021 FY2021 1. 5,628.0 6,864.3 350.6 233.2 7,095.3 372.9 249.8 7,918.9 483.3 290.5M 192.2M 8,916.1 743.1 506.1 13% 54% 67% 18% 27% 302.3 27% 172.1M 203.1 217.4 263.1 440.8 68% 23% 2. 43.03 18% Financial performance: Sales (Sm) EBIT (SM) NPAT (S) Basic EPS (cents) Shareholder value created: Company share price at the end of the reporting period ($) Market capitalisation (m) Enterprise value ($m) Movement in enterprise value during the financial year ($m) Dividends paid to shareholders during the financial year (Sm) Shareholder value created - per annum ($m) - cumulative ($m) since IPO 23.37 2,674.0 3,160.0 22.52 2,587.2 2,984.5 25.85 2,969.7 3,289.6 50.58 5,810.8 16% 19% 18% 4,943.4 4,691.9 5,547.6 18% 18% 717.5 (175.5) 305.1 1,402.3 855.7 119.1 151.6 157.4 172.3 310.2 80% 27% 462.5 836.6 3.928.1 (23.9) 3,904.2 1,574.6 5,941.3 1,165.9 7,107.2 4.366.7 20% 22% Enterprise value is measured as the sum of market capitalisation and net debt. Shareholder value created is measured as the increase in the enterprise value, plus cash dividends and share buy-backs paid during the financial year. Cumulative shareholder value is measured from the date of listing in October 2003 when opening shareholder value was $201.7m. (H) Percentage movement shown is the compound annual growth rate over the last 5 years. W Percentage movement shown is the compound annual growth rate since IPO in 2003. V FY2017 EBIT, net profit and EPS exclude transaction fees and implementation costs totaling $22.4m associated with the acquisition of The Good Guys in November 2016 but include New Zealand Goodwill and New Zealand Fixed Asset impairments of $15.8 million. MFY2017 to FY2019 results are prior to the adoption of AASB 16 Leases