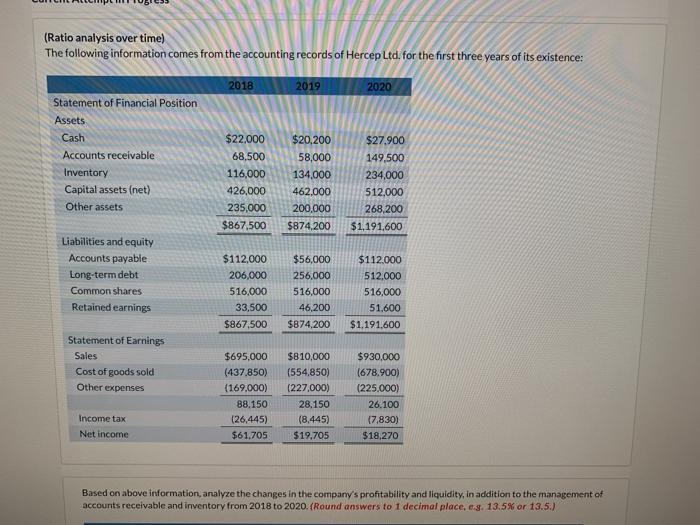
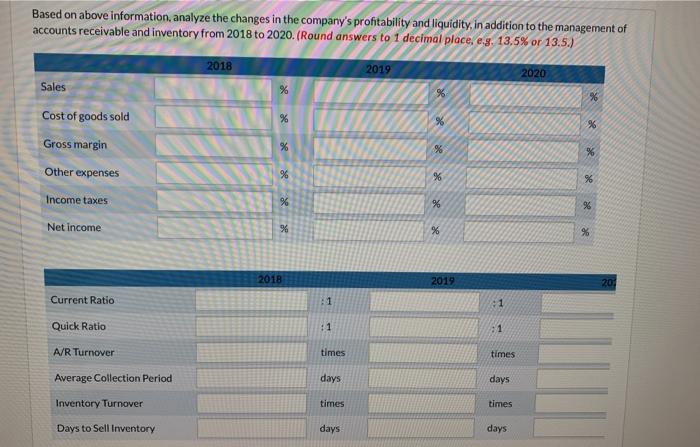
(Ratio analysis over time) The following information comes from the accounting records of Hercep Ltd. for the first three years of its existence: 2018 2019 2020 Statement of Financial Position Assets Cash Accounts receivable Inventory Capital assets (net) Other assets $22.000 68,500 116,000 426,000 235,000 $867.500 $20,200 58,000 134.000 462.000 200,000 $874,200 $27.900 149,500 234.000 512.000 268,200 $1,191,600 Liabilities and equity Accounts payable Long-term debt Common shares Retained earnings $112,000 206,000 516,000 33,500 $867,500 $56,000 256,000 516,000 46,200 $874,200 $112.000 512,000 516,000 51.600 $1.191,600 Statement of Earnings Sales Cost of goods sold Other expenses $695,000 (437.850) (169,000) 88,150 (26,445) $61,705 $810,000 (554.850) (227.000) 28.150 (8,445) $19.705 $930,000 (678.900) (225.000) 26.100 17,830) $18,270 Income tax Net income Based on above information, analyze the changes in the company's profitability and liquidity. In addition to the management of accounts receivable and inventory from 2018 to 2020. (Round answers to 1 decimal place, e.g. 13.5% or 13.5.) Based on above information, analyze the changes in the company's profitability and liquidity, in addition to the management of accounts receivable and inventory from 2018 to 2020. (Round answers to 1 decimal place, e.g. 13.5% or 13.5.) 2018 2019 2020 Sales % % %6 % % % % % % Cost of goods sold Gross margin Other expenses Income taxes Net income %6 %6 %6 % % % 96 % 2018 2019 20 Current Ratio 1 1 Quick Ratio : 1 A/R Turnover times times Average Collection Period days days Inventory Turnover times times Days to Sell Inventory days days Based on the above information, analyze the company's use of leverage from 2018 to 2020. (Round answers to 1 decimal place, e.g. 15.1%) 2018 2019 2020 Debt to Equity % % % Return on Assets % % 56 Return on Equity % % 96