Question
Ratio Analysis Use the Balance Sheet and Income Statement information to calculate the following ratios in 2021: Liquidity Ratios current ratio interval measure and net
- Ratio Analysis
Use the Balance Sheet and Income Statement information to calculate the following ratios in 2021:
- Liquidity Ratios
current ratio interval measure and net working capital to total asset
- Long-term solvency, or financial leverage ratios
Total debt ratio, long-term debt ratio and cash coverage ratio
- Asset management, or turnover, ratios
Inventory turnover, days sales inventory, net working capital turnover and net fixed asset turnover
Profitability ratios
Return on assets and return on equity
Market value ratios (Market Price per share = $10, Number of Shares Outstanding
= 100m) Price-Earnings ratio, enterprise value and EBITDA ratio

This is a one part question
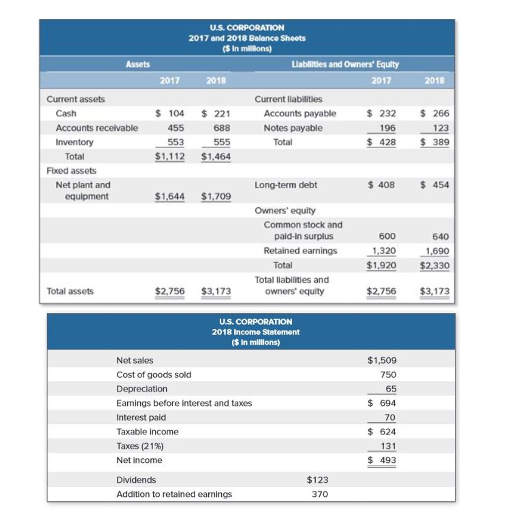
Assets 2018 U.S. CORPORATION 2017 and 2018 Balance Sheets ($ In millions) Labiltles and Owners' Equity 2017 2018 2017 Current liabilities $ 104 $ 221 Accounts payable $ 232 688 Notes payable 196 553 555 Total $ 428 $1,112 $1.464 455 Current assets Cash Accounts receivable Inventory Total Fixed assets Net plant and equipment $ 266 123 $ 389 Long-term debt $ 408 $ 454 $1,644 $1.709 Owners' equity Common stock and paid-in surplus Retained earnings Total Total liabilities and owners' equity 600 1,320 $1.920 640 1,690 $2,330 Total assets $2,756 $3,173 $2,756 $3,173 U.S. CORPORATION 2018 Income Statement ($ in millions) Net sales Cost of goods sold Depreciation Earnings before interest and taxes Interest paid Taxable income Taxes (21%) Net income $1,509 750 65 $ 694 70 $ 624 131 493 Dividends Addition to retained earnings $123 370 Assets 2018 U.S. CORPORATION 2017 and 2018 Balance Sheets ($ In millions) Labiltles and Owners' Equity 2017 2018 2017 Current liabilities $ 104 $ 221 Accounts payable $ 232 688 Notes payable 196 553 555 Total $ 428 $1,112 $1.464 455 Current assets Cash Accounts receivable Inventory Total Fixed assets Net plant and equipment $ 266 123 $ 389 Long-term debt $ 408 $ 454 $1,644 $1.709 Owners' equity Common stock and paid-in surplus Retained earnings Total Total liabilities and owners' equity 600 1,320 $1.920 640 1,690 $2,330 Total assets $2,756 $3,173 $2,756 $3,173 U.S. CORPORATION 2018 Income Statement ($ in millions) Net sales Cost of goods sold Depreciation Earnings before interest and taxes Interest paid Taxable income Taxes (21%) Net income $1,509 750 65 $ 694 70 $ 624 131 493 Dividends Addition to retained earnings $123 370Step by Step Solution
There are 3 Steps involved in it
Step: 1

Get Instant Access to Expert-Tailored Solutions
See step-by-step solutions with expert insights and AI powered tools for academic success
Step: 2

Step: 3

Ace Your Homework with AI
Get the answers you need in no time with our AI-driven, step-by-step assistance
Get Started


