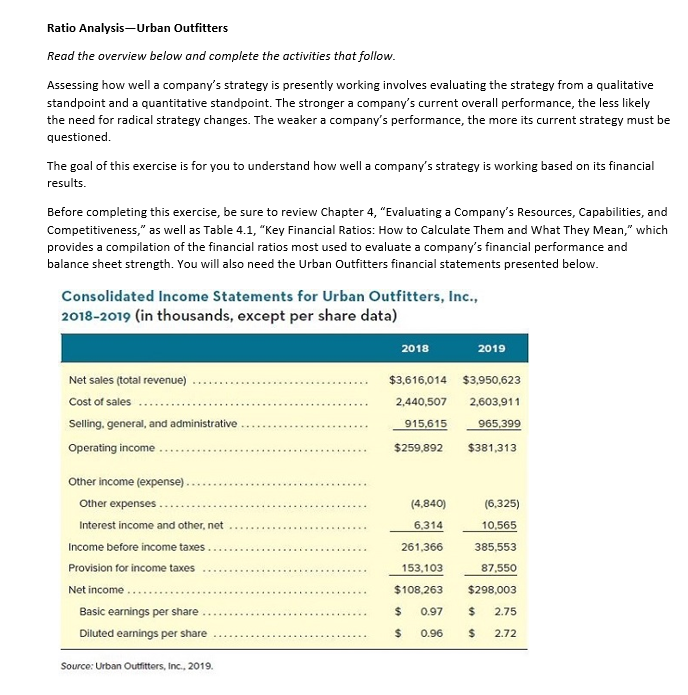
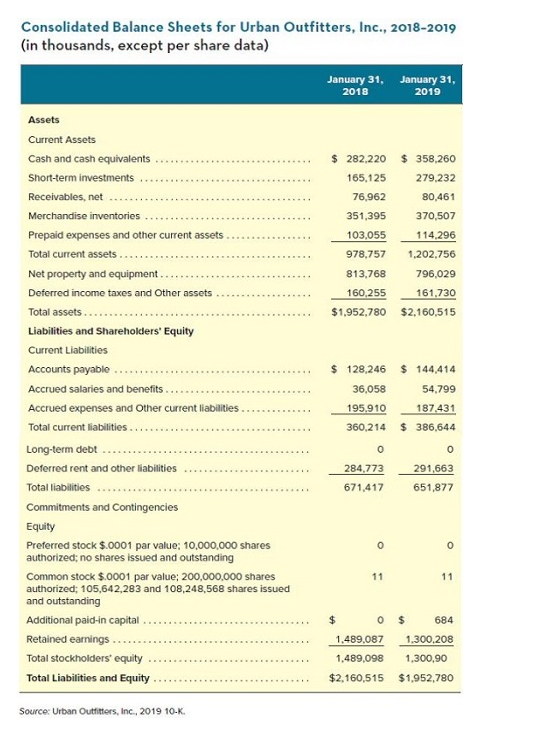
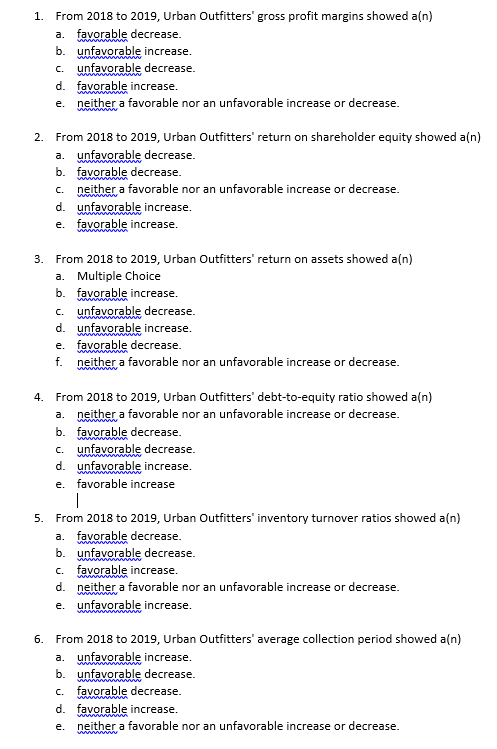
Ratio AnalysisUrban Outfitters Read the overview below and complete the activities that follow. Assessing how well a company's strategy is presently working involves evaluating the strategy from a qualitative standpoint and a quantitative standpoint. The stronger a company's current overall performance, the less likely the need for radical strategy changes. The weaker a company's performance, the more its current strategy must be questioned. The goal of this exercise is for you to understand how well a company's strategy is working based on its financial results. Before completing this exercise, be sure to review Chapter 4, "Evaluating a Company's Resources, Capabilities, and Competitiveness," as well as Table 4.1, "Key Financial Ratios: How to Calculate them and What They Mean," which provides a compilation of the financial ratios most used to evaluate a company's financial performance and balance sheet strength. You will also need the Urban Outfitters financial statements presented below. Consolidated Income Statements for Urban Outfitters, Inc., 2018-2019 (in thousands, except per share data) 2018 2019 Net sales (total revenue) Cost of sales Selling, general, and administrative Operating income $3,616,014 $3.950,623 2,440,507 2,603,911 915,615 965,399 $259,892 $381,313 (6,325) 10,565 Other income (expense). Other expenses. Interest income and other, net Income before income taxes Provision for income taxes Net income Basic earnings per share Diluted earnings per share (4,840) 6,314 261,366 153,103 $108,263 385,553 87,550 $298,003 $ 0.97 $ 2.75 $ 0.96 $ 2.72 Source: Urban Outfitters, Inc., 2019. Consolidated Balance Sheets for Urban Outfitters, Inc., 2018-2019 (in thousands, except per share data) January 31, January 31, 2018 2019 $ 282,220 $ 358,260 165,125 279,232 76,962 80,461 351,395 370,507 103,055 114.296 978,757 1,202,756 813.768 796,029 160,255 161,730 $1,952,780 $2,160,515 Assets Current Assets Cash and cash equivalents Short-term investments Receivables, net Merchandise inventories Prepaid expenses and other current assets Total current assets Net property and equipment.. Deferred income taxes and other assets Total assets... Liabilities and Shareholders' Equity Current Liabilities Accounts payable Accrued salaries and benefits Accrued expenses and other current liabilities Total current liabilities Long-term debt Deferred rent and other liabilities Total liabilities Commitments and Contingencies Equity Preferred stock $.0001 par value: 10,000,000 shares authorized; no shares issued and outstanding Common stock $.0001 par value; 200,000,000 shares authorized: 105,642,283 and 108,248,568 shares issued and outstanding Additional paid-in capital Retained earnings Total stockholders' equity Total Liabilities and Equity $ 128,246 $144,414 36,058 54.799 195.910 187.431 360,214 $ 386,644 0 o 284.773 671,417 291,663 651,877 0 0 11 11 $ 1.489,087 1,489,098 $2,160,515 684 1.300.208 1,300,90 $1,952,780 Source: Urban Outfitters, Inc., 2019 10-K. a. WW 1. From 2018 to 2019, Urban Outfitters' gross profit margins showed a(n) favorable decrease. b. unfavorable increase. c. unfavorable decrease. d. favorable increase. e neither a favorable nor an unfavorable increase or decrease. 2. From 2018 to 2019, Urban Outfitters' return on shareholder equity showed a(n) a. unfavorable decrease. b. favorable decrease. c. neither a favorable nor an unfavorable increase or decrease. d. unfavorable increase. e. favorable increase. 3. From 2018 to 2019, Urban Outfitters' return on assets showed a(n) a. Multiple Choice b. favorable increase. c. unfavorable decrease. d. unfavorable increase. e. favorable decrease. f. neither a favorable nor an unfavorable increase or decrease. 4. From 2018 to 2019, Urban Outfitters' debt-to-equity ratio showed a(n) a neither a favorable nor an unfavorable increase or decrease. b. favorable decrease. c. unfavorable decrease. d. unfavorable increase. e. favorable increase | 5. From 2018 to 2019, Urban Outfitters' inventory turnover ratios showed a(n) a. favorable decrease. b. unfavorable decrease. c. favorable increase. d. neither a favorable nor an unfavorable increase or decrease. e. unfavorable increase. 6. From 2018 to 2019, Urban Outfitters' average collection period showed a(n) a. unfavorable increase. b. unfavorable decrease. C. favorable decrease. d. favorable increase. e. neither a favorable nor an unfavorable increase or decrease