Answered step by step
Verified Expert Solution
Question
1 Approved Answer
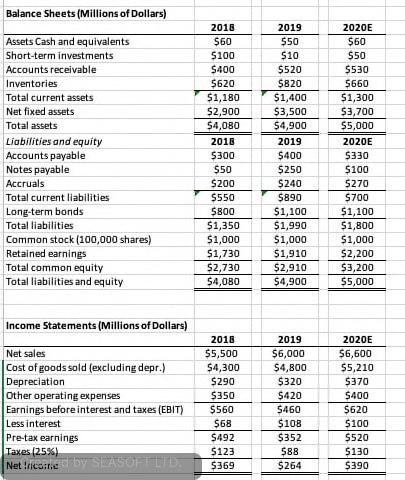
ratio Formula? 2018? 2019? 2020? Debt ratio debt-to-equity ratio Liabilities-to-assets ratio, times-interest-earned ratio, and EBITDA coverage ratios How does Computron compare with the industry with

| ratio | Formula? | 2018? | 2019? | 2020? |
| Debt ratio | ||||
| debt-to-equity ratio | ||||
| Liabilities-to-assets ratio, | ||||
| times-interest-earned ratio, | ||||
| and EBITDA coverage ratios |
How does Computron compare with the industry with respect to financial leverage?
What can you conclude from these ratios?
Thank you!!!
Balance Sheets (Millions of Dollars) Assets Cash and equivalents Short-term investments Accounts receivable Inventories Total current assets Net fixed assets Total assets Liabilities and equity Accounts payable Notes payable Accruals Total current liabilities Long-term bonds Total liabilities Common stock (100,000 shares) Retained earnings Total common equity Total liabilities and equity 2018 $50 $100 5400 5620 $1,180 $2,900 54,080 2018 5300 $50 $200 5550 5800 $1,350 $1,000 $1,730 $2,730 54,080 2019 550 510 $520 5820 $1,400 $3,500 54,900 2019 5400 $250 $240 $890 $1,100 $1,990 $1,000 $1,910 $2,910 $4,900 2020E $60 $50 5530 5660 51,300 53,700 55,000 2020E 5330 $100 5270 5700 $1,100 51,800 51,000 $2,200 $3,200 $5,000 Income Statements (Millions of Dollars) Net sales Cost of goods sold (excluding depr.) Depreciation Other operating expenses Earnings before interest and taxes (EBIT) Less interest Pre-tax earnings Taxes (25%) Net Incored by SEASOFT LTD 2018 55,500 $4,300 5290 $350 $560 $68 5492 5123 5369 2019 $6,000 $4,800 $320 $420 5460 $108 $352 588 $264 2020E 56,600 55,210 5370 $400 $620 5100 5520 $130 $390 Balance Sheets (Millions of Dollars) Assets Cash and equivalents Short-term investments Accounts receivable Inventories Total current assets Net fixed assets Total assets Liabilities and equity Accounts payable Notes payable Accruals Total current liabilities Long-term bonds Total liabilities Common stock (100,000 shares) Retained earnings Total common equity Total liabilities and equity 2018 $50 $100 5400 5620 $1,180 $2,900 54,080 2018 5300 $50 $200 5550 5800 $1,350 $1,000 $1,730 $2,730 54,080 2019 550 510 $520 5820 $1,400 $3,500 54,900 2019 5400 $250 $240 $890 $1,100 $1,990 $1,000 $1,910 $2,910 $4,900 2020E $60 $50 5530 5660 51,300 53,700 55,000 2020E 5330 $100 5270 5700 $1,100 51,800 51,000 $2,200 $3,200 $5,000 Income Statements (Millions of Dollars) Net sales Cost of goods sold (excluding depr.) Depreciation Other operating expenses Earnings before interest and taxes (EBIT) Less interest Pre-tax earnings Taxes (25%) Net Incored by SEASOFT LTD 2018 55,500 $4,300 5290 $350 $560 $68 5492 5123 5369 2019 $6,000 $4,800 $320 $420 5460 $108 $352 588 $264 2020E 56,600 55,210 5370 $400 $620 5100 5520 $130 $390Step by Step Solution
There are 3 Steps involved in it
Step: 1

Get Instant Access to Expert-Tailored Solutions
See step-by-step solutions with expert insights and AI powered tools for academic success
Step: 2

Step: 3

Ace Your Homework with AI
Get the answers you need in no time with our AI-driven, step-by-step assistance
Get Started


