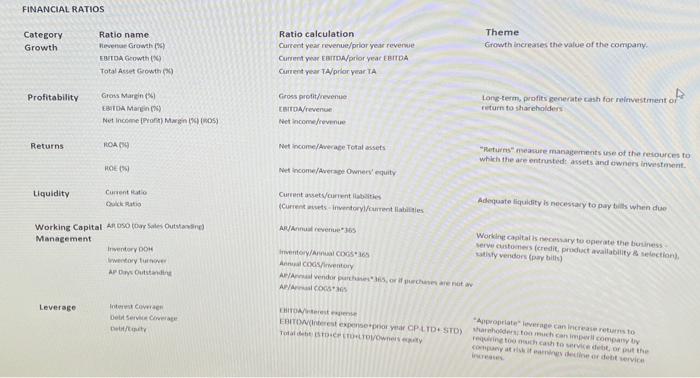
ration cheat sheet
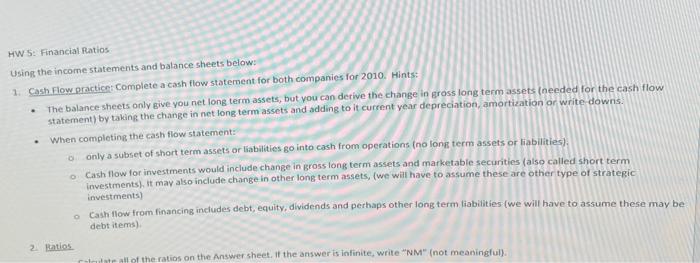
instructions
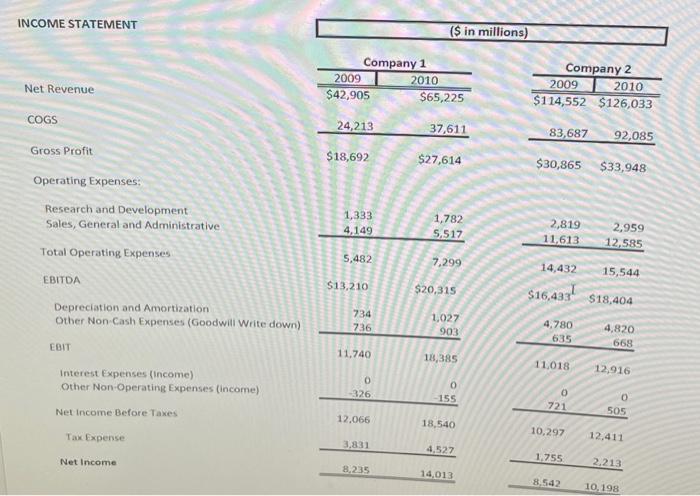
income statement
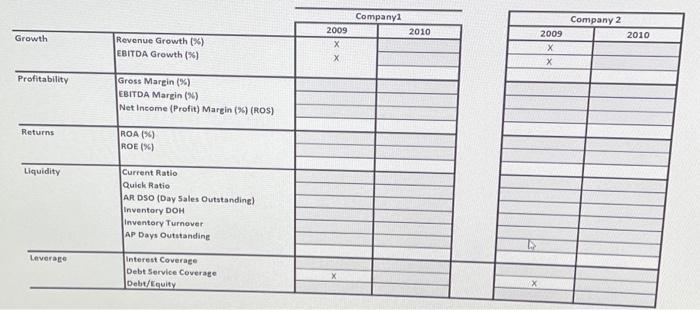
Homework (must fill out ratios)
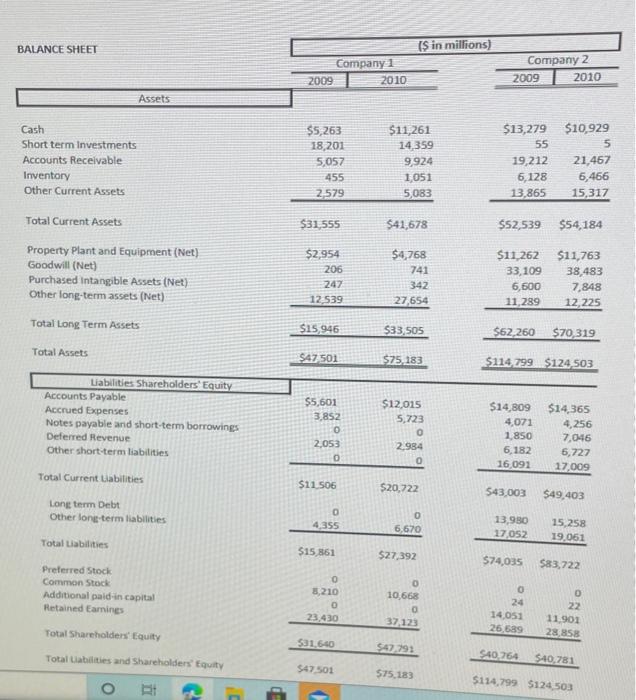
balance sheet
FINANCIAL RATIOS Category Growth Theme Growth increases the value of the company. Ratio name Never Growth EBETDA Growth Total Asset Growth Ratio calculation Current year revenue/prior year revenue Current Ear/prior veac EBITDA Gurrent year A/orfor year TA Profitability Gross Marin EBITDA Margin96 Net Income (Pro) Mwa OS) Gross profit/revenue CATA/revence Net Income Long-term profits generate cash for reinvestment of return to shareholders Returns ROA 09 Net.com/Average Total assets "Returns mature managements use of the resources to which the are entrusted assets and owners Investment MOE Net Income/Avere Owner'equity Liquidity Currento Quick Ratio Current assets/currenties Current ses inventory/current abilities Adequate liquidity is necessary to pay is when we Working Capital ARDO (Day Sales Outstandine Management Inventory DOH www.tory APO Outstand AR/Annual Revenue 365 Working Capitalisary to operate the business sew customers credit product availability & selection, sisty vendors ay) Inventory/CD165 Adventory Allendor purcharreneta ACOGS Leverage It cover Del Service Center Orest Appropriate levere can increase returns to EMTOM est expemerio y CP LTD STD) och company to hashto, or put the To LTO Cor det service . HW 5: Financial Ratios Using the income statements and balance sheets below: 1. Cash Flow practice: Complete a cash flow statement for both companies for 2010. Hints: The balance sheets only give you net long term assets, but you can derive the change in gross long term assets (needed for the cash flow statement) by taking the change in net long term assets and adding to it current year depreciation, amortization or write downs. When completing the cash flow statement: only a subset of short term assets or liabilities go into cash from operations (no long term assets or liabilities) Cash flow for investments would include change in gross long term assets and marketable securities (also called short term investments), it may also include change in other long term assets, (we will have to assume these are other type of strategic investments) e cash flow from financing includes debt, equity, dividends and perhaps other long term liabilities (we will have to assume these may be debt items) 2. Ratios ut all of the ratios on the Answer sheet. If the answer is latinite, write "NM" (not meaningful). INCOME STATEMENT ($ in millions) Net Revenue Company 1 2009 2010 $42,905 $65,225 Company 2 2009 2010 $114,552 $126,033 COGS 24,213 37,611 83,687 92,085 Gross Profit $18,692 $27,614 $30,865 $33,948 Operating Expenses: Research and Development Sales, General and Administrative Total Operating Expenses 1,333 4,149 1,782 5,517 2,819 11,613 2,959 12,585 5,482 7,299 14,432 15,544 EBITDA $13,210 $20,315 $16,437 $18,404 Depreciation and Amortization Other Non-Cash Expenses (Goodwill Write down) 734 736 1,027 903 4.780 635 4,820 668 EBIT 11,740 14,385 11,018 12,916 Interest Expenses (income) Other Non-Operating Expenses (income) O -326 0 - 155 0 721 0 505 Net Income Before Taxes 12.066 18,540 10,297 Tax Expense 12.411 3,831 4,527 1.755 Net Income 2.213 8,235 14.013 8.542 10,198 2010 Company 2 2010 Growth Companyi 2009 X Revenue Growth (%) EBITDA Growth (%) 2009 X x Profitability Gross Margin (%) EBITDA Margin (9) Net Income (Profit) Margin (%) (ROS) Returns ROA (%) ROE (%) Liquidity Current Ratio Quick Ratio AR DSO (Day Sales Outstanding) Inventory DOH Inventory Turnover AP Days Outstanding Leverage Interest Coverage Debt Service Coverage Debt/Equity X BALANCE SHEET (S in millions) Company 1 2009 2010 Company 2 2009 2010 Assets Cash Short term Investments Accounts Receivable Inventory Other Current Assets $5,263 18,201 5,057 455 2.579 $11,261 14,359 9,924 1051 5,083 $13,279 $10,929 55 5 19,212 21,467 6,128 6,466 13,865 15,317 $31,555 $41,678 $52,539 $54,184 Total Current Assets Property Plant and Equipment (Net) Goodwill (Net) Purchased Intangible Assets (Net) Other long-term assets (Net) Total Long Term Assets $2,954 206 247 12 539 $4,768 741 342 27,654 $11,262 33,109 6,600 11,289 $11,763 38,483 7,848 12,225 $15.946 $33,505 $62,260 $70,319 Total Assets $47501 $75.183 $114 299 $124.503 $5,601 3.852 0 2,053 0 Liabilities Shareholders' Equity Accounts Payable Accrued Expenses Notes payable and short-term borrowings Deferred Revenue Other short-term liabilities Total Current abilities Long term Debt Other long term liabilities Total Liabilities $12,015 5,723 0 2.984 0 $14,809 4,071 1.850 6,182 16.091 $14,365 4,256 7,046 6,727 17,009 $11.506 $20,722 543,003 $49,403 0 4.355 0 6.670 13,930 17,052 15,258 19.061 $15,861 $27,392 $74,035 $83,722 Preferred Stock Common Stock Additional paid-in capital Retained Earnings o 3,210 O 23,430 O 10,668 0 24 14.053 26.689 0 22 11.901 28 858 37,123 Total Shareholders' Equity 531.640 $47.793 Total abilities and Shareholders' Equity S40.764 $40,781 547 501 575.183 $114.799 $124 503 o T
 ration cheat sheet
  instructions
  income statement
  Homework (must fill out ratios)
 balance sheet


