Answered step by step
Verified Expert Solution
Question
1 Approved Answer
Rational functions can model key economic information for businesses. In manufacturing, start-up costs can be high because of the equipment required to make a


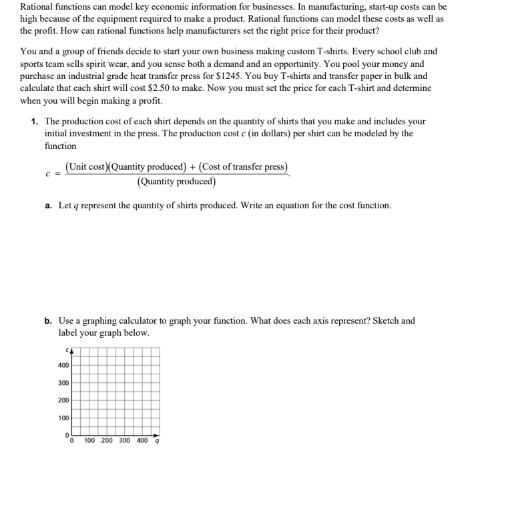
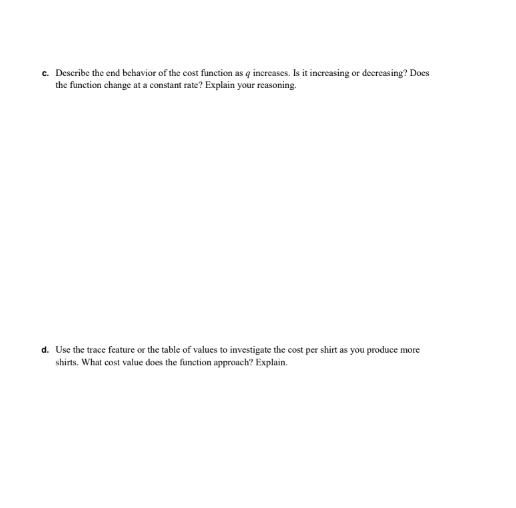
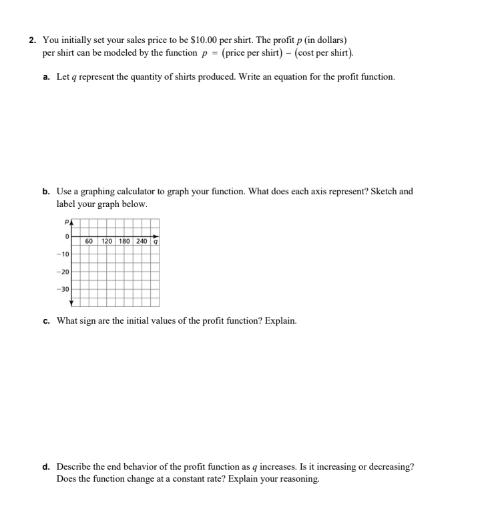
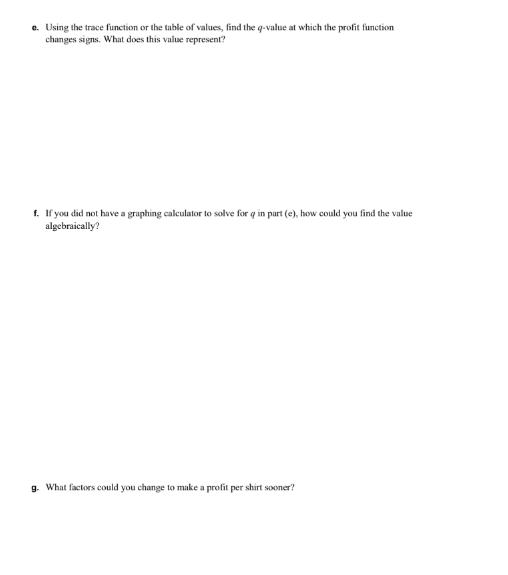
Rational functions can model key economic information for businesses. In manufacturing, start-up costs can be high because of the equipment required to make a product. Rational functions can model these costs as well as the profit. How can rational functions help manufacturers set the right price for their product? You and a group of friends decide to start your own business making custom T-shirts. Every school club and sports team sells spirit wear, and you sense both a demand and an opportunity. You pool your money and purchase an industrial grade heat transfer press for $1245. You buy T-shirts and transfer paper in bulk and calculate that each shirt will cost $2.50 to make. Now you must set the price for each T-shirt and determine when you will begin making a profit. 1. The production cost of each shirt depends on the quantity of shirts that you make and includes your initial investment in the press. The production cost c (in dollars) per shirt can be modeled by the function C = (Unit cost XQuantity produced) + (Cost of transfer press) (Quantity produced) a. Let q represent the quantity of shirts produced. Write an equation for the cost function. b. Use a graphing calculator to graph your function. What does each axis represent? Sketch and label your graph below. CA 400 300 200 100 0 0 100 200 300 400 c. Describe the end behavior of the cost function as q increases. Is it increasing or decreasing? Does the function change at a constant rate? Explain your reasoning. d. Use the trace feature or the table of values to investigate the cost per shirt as you produce more shirts. What cost value does the function approach? Explain. 2. You initially set your sales price to be $10.00 per shirt. The profit p (in dollars) per shirt can be modeled by the function p- (price per shirt) - (cost per shirt). a. Let q represent the quantity of shirts produced. Write an equation for the profit function. b. Use a graphing calculator to graph your function. What does each axis represent? Sketch and label your graph below. PA 0 -10 -20 -30 60 120 180 240 g c. What sign are the initial values of the profit function? Explain. d. Describe the end behavior of the profit function as q increases. Is it increasing or decreasing? Does the function change at a constant rate? Explain your reasoning, e. Using the trace function or the table of values, find the q-value at which the profit function changes signs. What does this value represent? f. If you did not have a graphing calculator to solve for q in part (e), how could you find the value algebraically? g. What factors could you change to make a profit per shirt sooner?
Step by Step Solution
★★★★★
3.42 Rating (142 Votes )
There are 3 Steps involved in it
Step: 1
Answ...
Get Instant Access to Expert-Tailored Solutions
See step-by-step solutions with expert insights and AI powered tools for academic success
Step: 2

Step: 3

Ace Your Homework with AI
Get the answers you need in no time with our AI-driven, step-by-step assistance
Get Started


