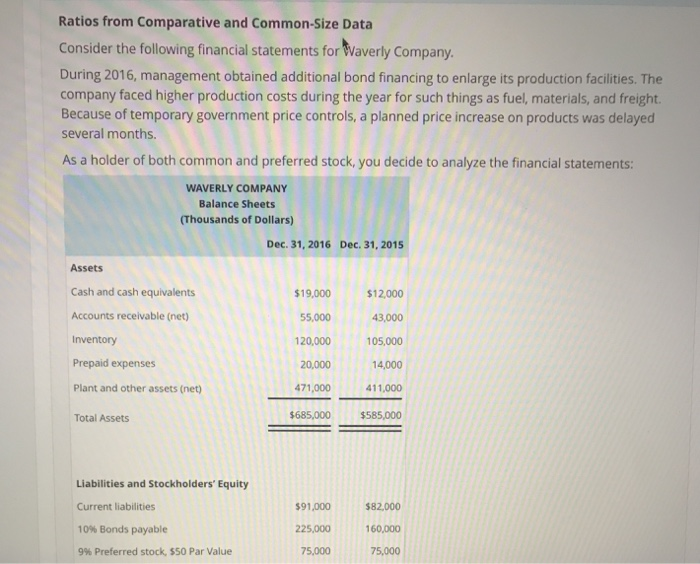
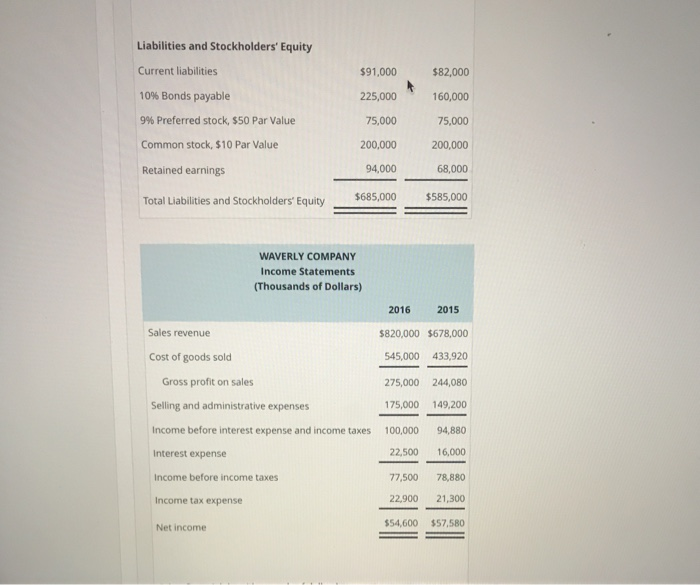
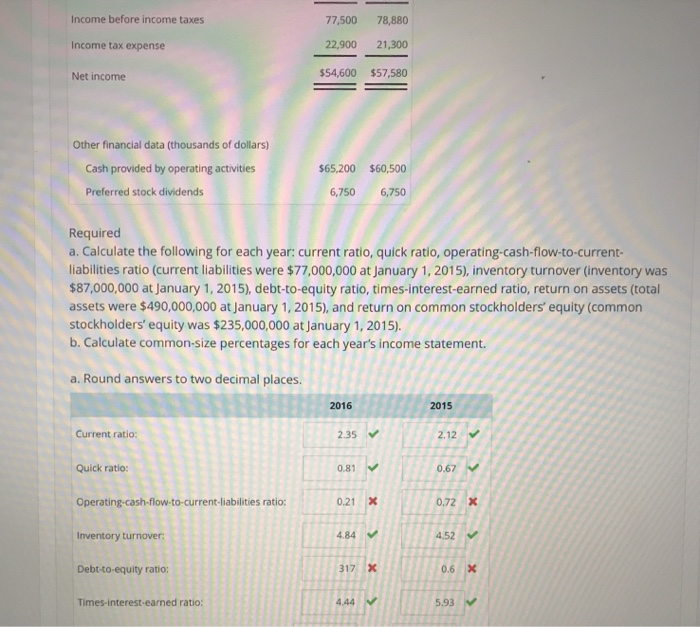
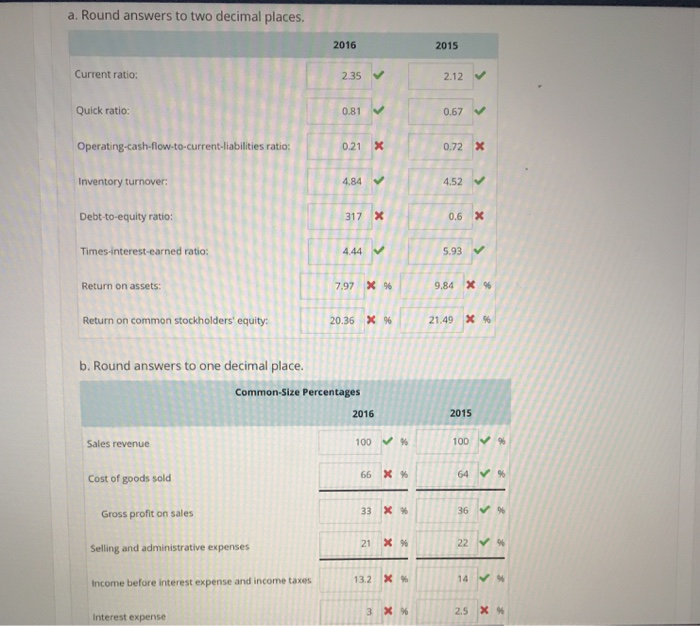
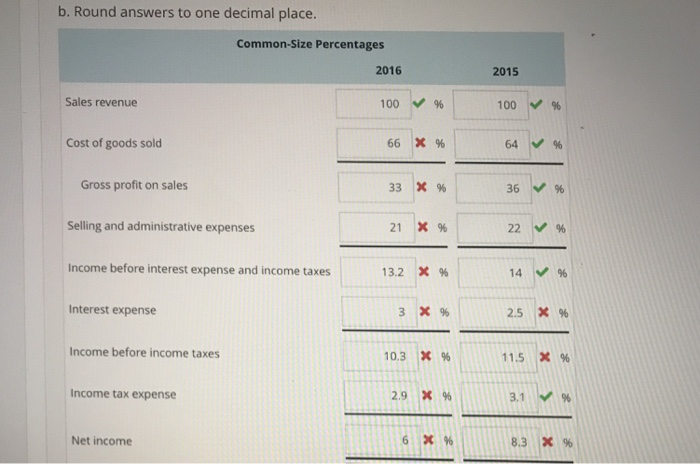
Ratios from Comparative and Common-Size Data Consider the following financial statements for Waverly Company During 2016, management obtained additional bond financing to enlarge its production facilities. The company faced higher production costs during the year for such things as fuel, materials, and freight. Because of temporary government price controls, a planned price increase on products was delayed several months. As a holder of both common and preferred stock, you decide to analyze the financial statements: WAVERLY COMPANY Balance Sheets (Thousands of Dollars) Dec. 31, 2016 Dec. 31, 2015 Assets Cash and cash equivalents Accounts receivable (net) Inventory Prepaid expenses Plant and other assets (net Total Assets 19,000$12,000 43,000 20,000 105,000 14,000 411,000 $685,000 $585,000 55,000 20,000 471,000 Liabilities and Stockholders' Equity Current liabilities 10% Bonds payable 9% Preferred stock, $50 Par Value 91,000$82.000 225,000 160,000 75,00075,000 Liabilities and Stockholders' Equity Current liabilities 10% Bonds payable 9% Preferred stock, $50 Par Value Common stock, $10 Par Value Retained earnings Total Liabilities and Stockholders Equity $91,000 $82,000 225,000 75,000 200,000 94,000 $685,000 160,000 75,000 200,000 68,000 $585,000 WAVERLY COMPANY Income Statements (Thousands of Dollars) 2016 2015 Sales revenue 820,000 $678,000 45,000 433,920 275,000 244,080 75,000 149,200 100,000 Cost of goods sold Gross profit on sales Selling and administrative expenses Income before interest expense and income taxes Interest expense Income before income taxes Income tax expense Net income 94,880 22,500 16,000 77,500 78,880 22,900 21,300 $54,600 $57,580 Income before income taxes Income tax expense Net income 77,500 78,880 22,900 21,300 $54,600 $57,580 Other financial data (thousands of dollars) Cash provided by operating activities 565,200 $60,500 Preferred stock dividends 6,750 6,750 Required a. Calculate the following for each year: current ratio, quick ratio, operating-cash-flow-to-current- liabilities ratio (current liabilities were $77,000,000 at January 1, 2015), inventory turnover (inventory was $87,000,000 at January 1, 2015), debt-to-equity ratio, times-interest-earned ratio, return on assets (total assets were $490,000,000 at January 1,2015), and return on common stockholders' equity (common stockholders' equity was $235,000,000 at January 1, 2015). b. Calculate common-size percentages for each year's income statement. a. Round answers to two decimal places. 2016 2015 Current ratio: 2.12 Quick ratio Operating-cash-flow-to-current-liabilities ratio: Inventory turnover Debt-to-equity ratio 2.35 0.81 0.21 X 4.84 0.67 0.72x 4.52 317 x 0.6 x Times-interest-earned ratio 4.44 5.93 a. Round answers to two decimal places 2016 2015 Current ratio; 2.35 2.12 Quick ratio: 0.81 0.67 Operating-cash-flow-to-current-iabilities ratio: Inventory turnover Debt-to-equity ratio: Times-interest-earned ratio: 0.21X 0.72X 484 4.52 317 0.6X 4.44 5.93 Return on assets: 7.97 x % 9.84 % Return on common stockholders' equity 20.36 % 21.49 X %! b. Round answers to one decimal place. Common-Size Percentages 2016 2015 Sales revenue 100 % 100 % 66 X 96 64 % Cost of goods sold % Gross profit on sales Selling and administrative expenses Income before interest expense and income taxes 33 21 % 13.2 X % 14 % 2.5 % Interest expense b. Round answers to one decimal place. Common-Size Percentages 2015 Sales revenue 100 % | 100 % Cost of goods sold 66 X % 64 % Gross profit on sales Selling and administrative expenses Income before interest expense and income taxes 33 X % 21 % 22 % 13.2 x % 14 % Interest expense 3x96 2.5 X % Income before income taxes 10.3 % 11.5 X % Income tax expense 2.9 % Net income 8.3 % 96