

Answered step by step
Verified Expert Solution
Question
1 Approved Answer
Ratlos and Elnanclal Plannlng at SRS Alr. Inc. Chris Guthrie was recently hired by S&S Alr. Inc., to assist the company with its financlal planning
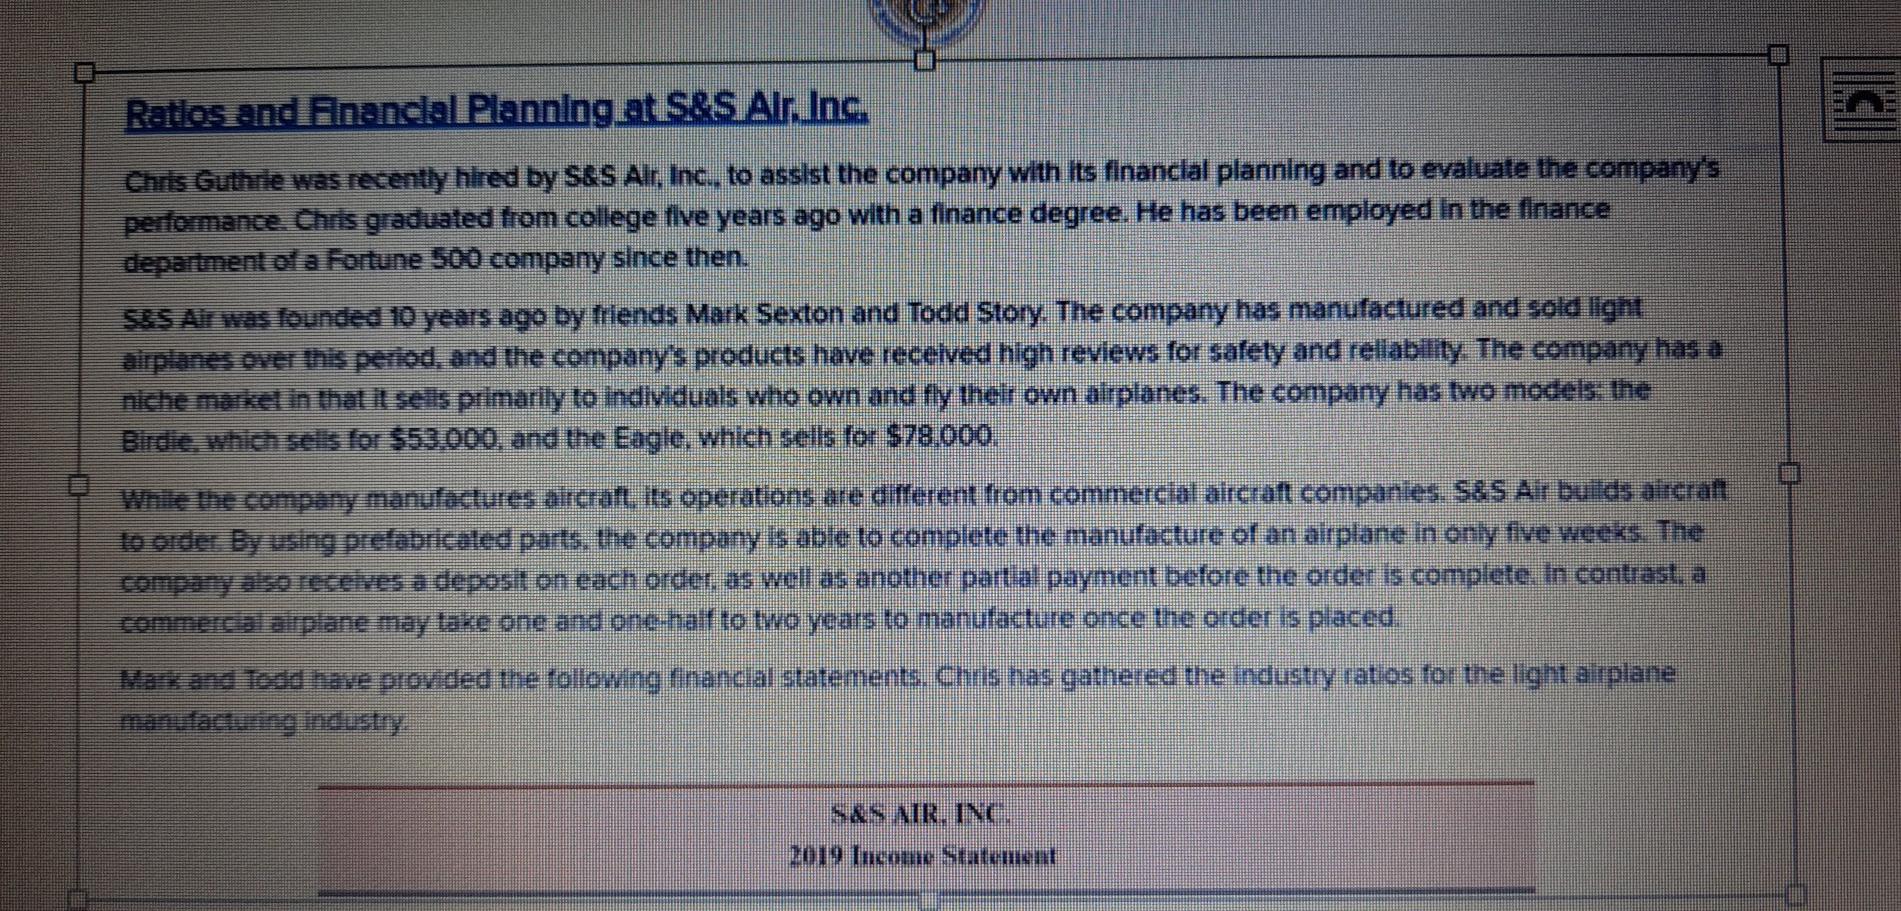
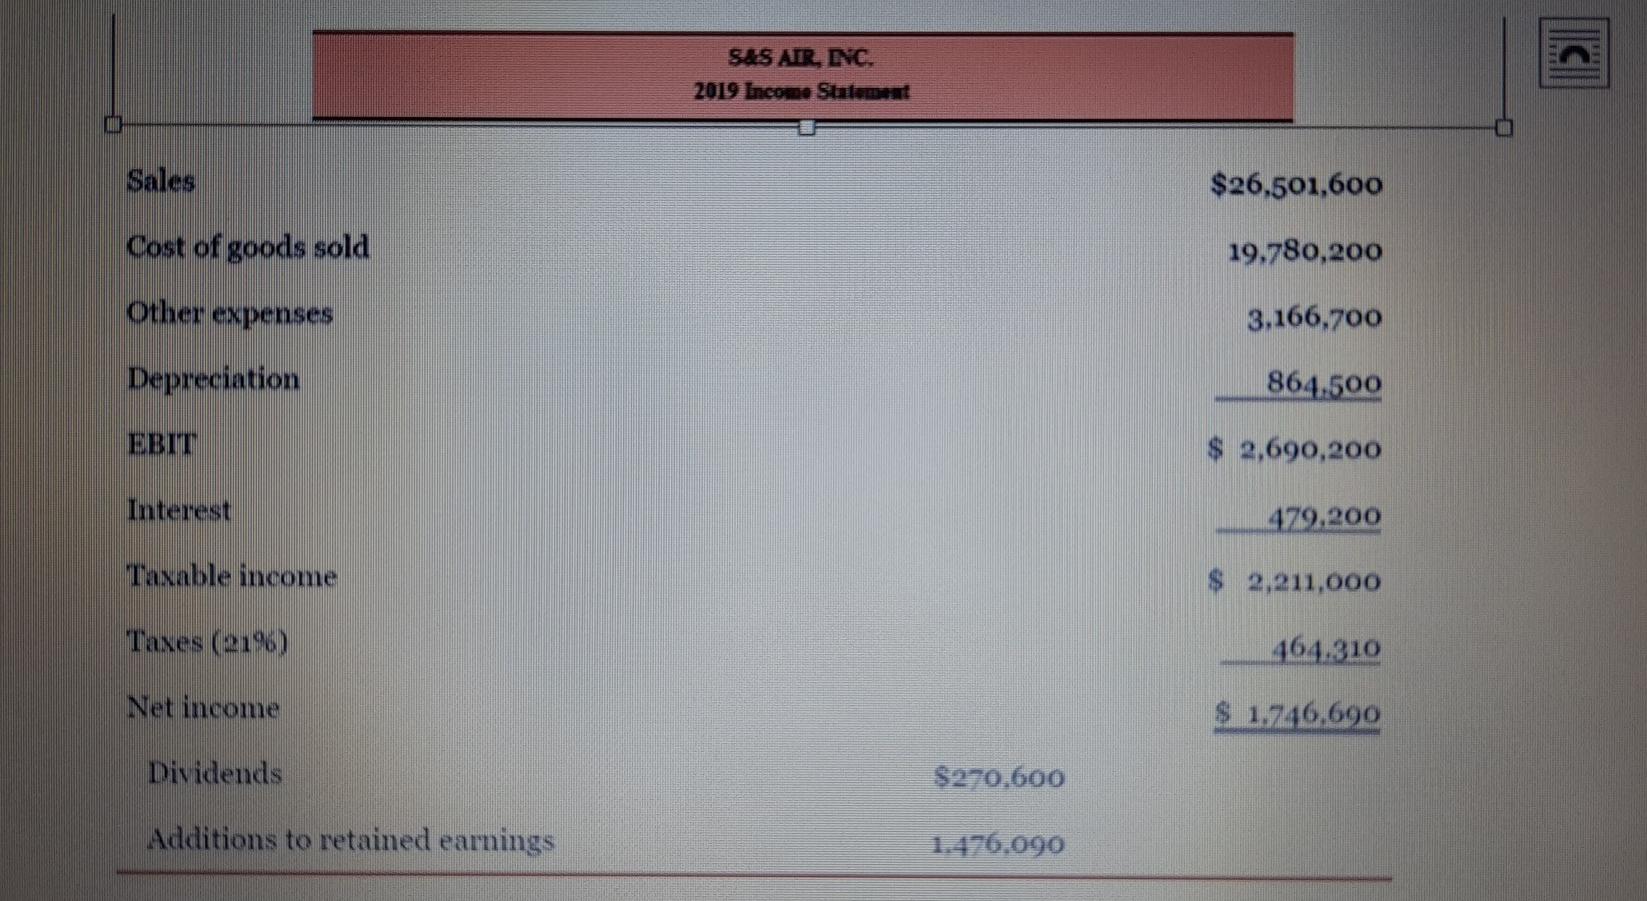
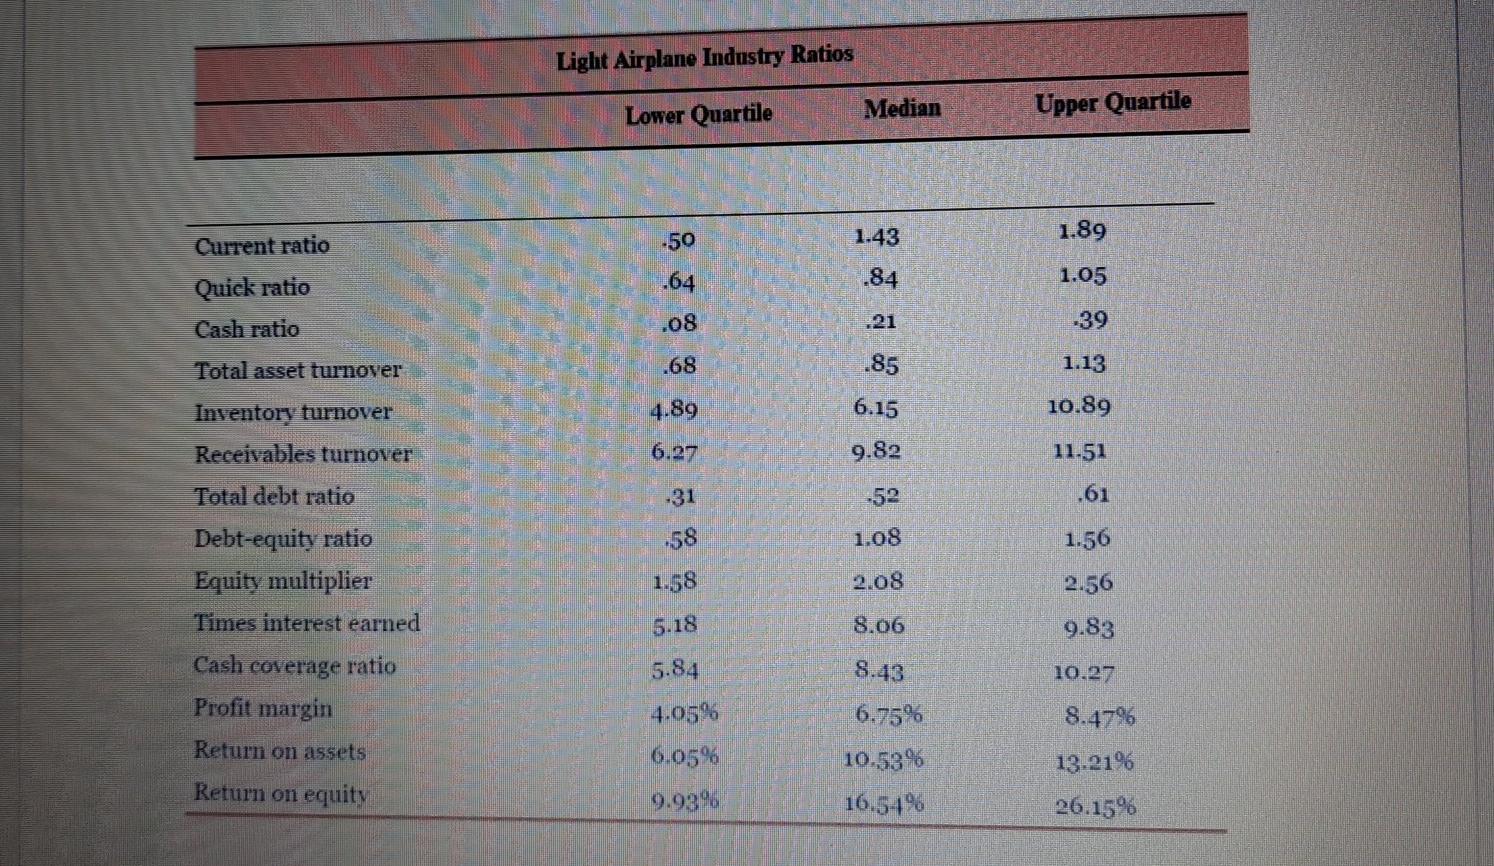
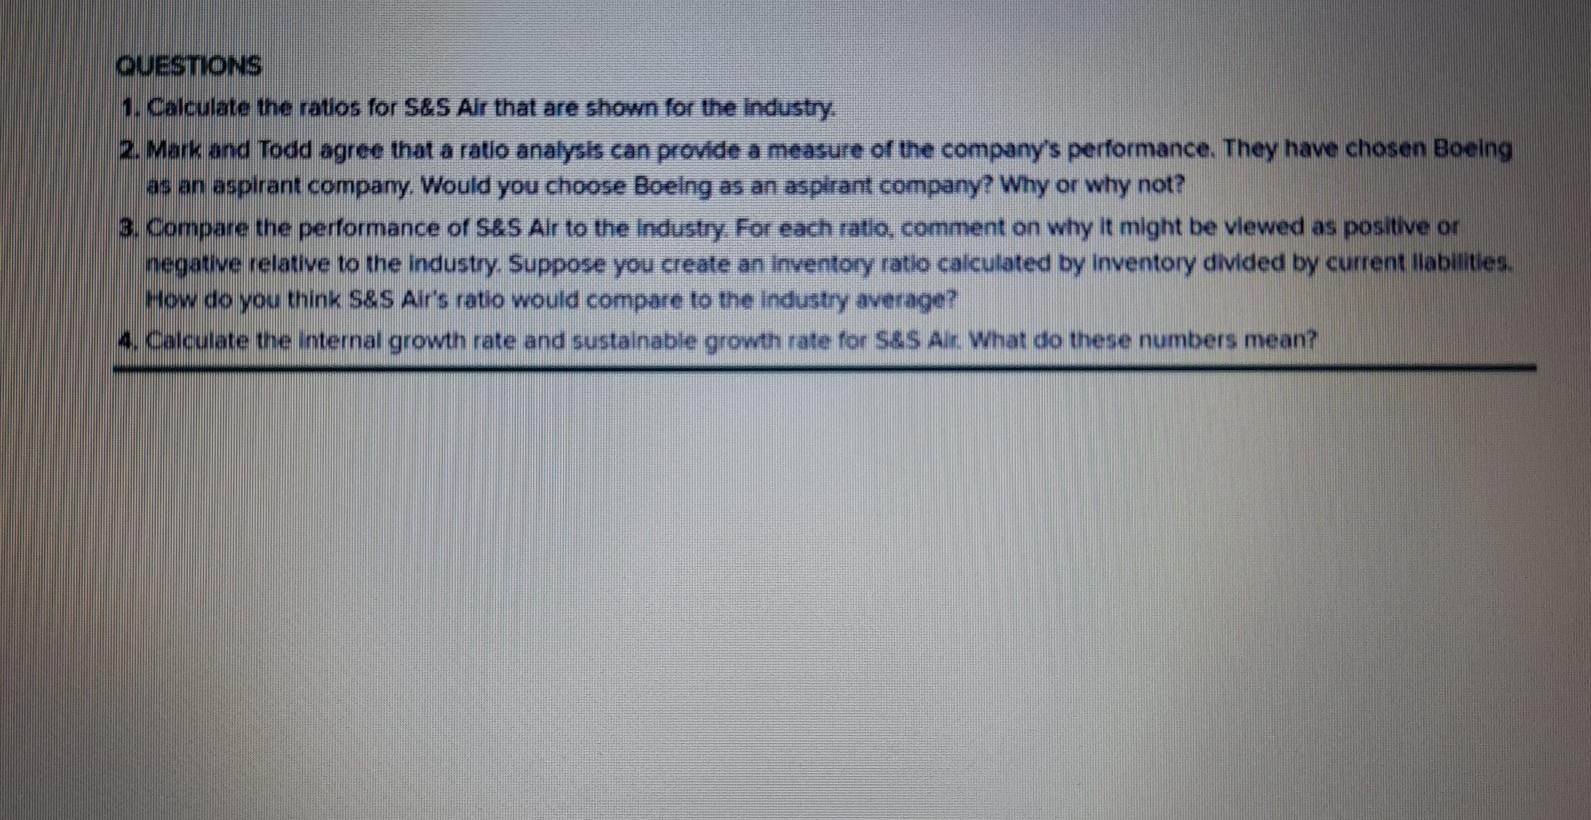
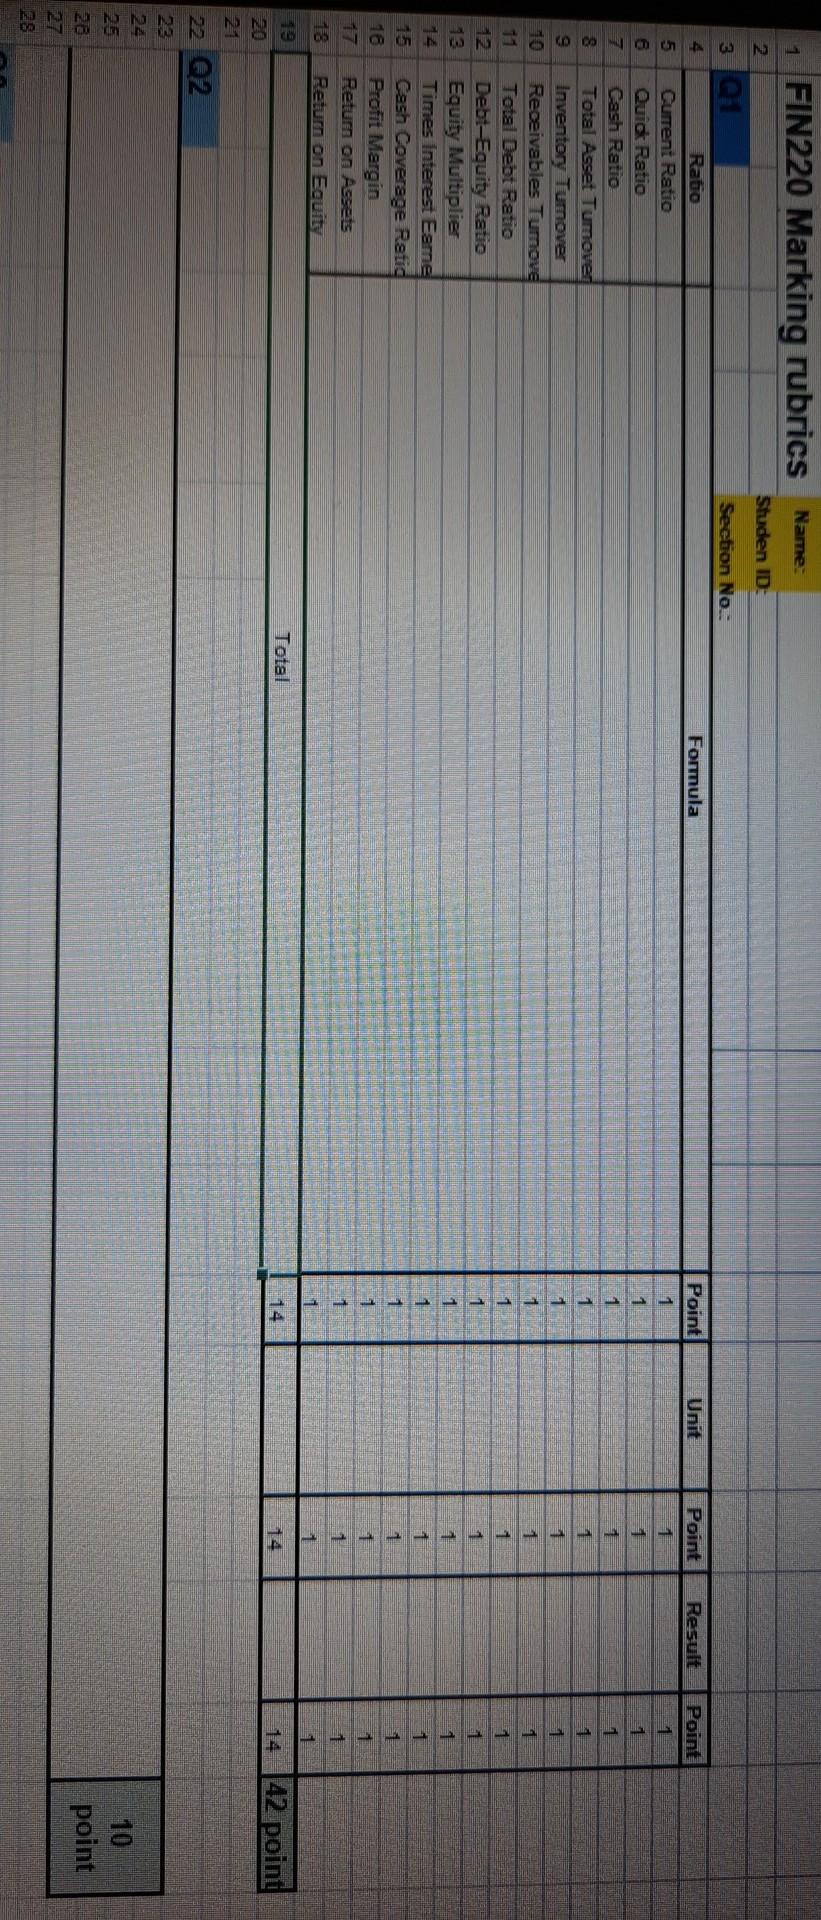
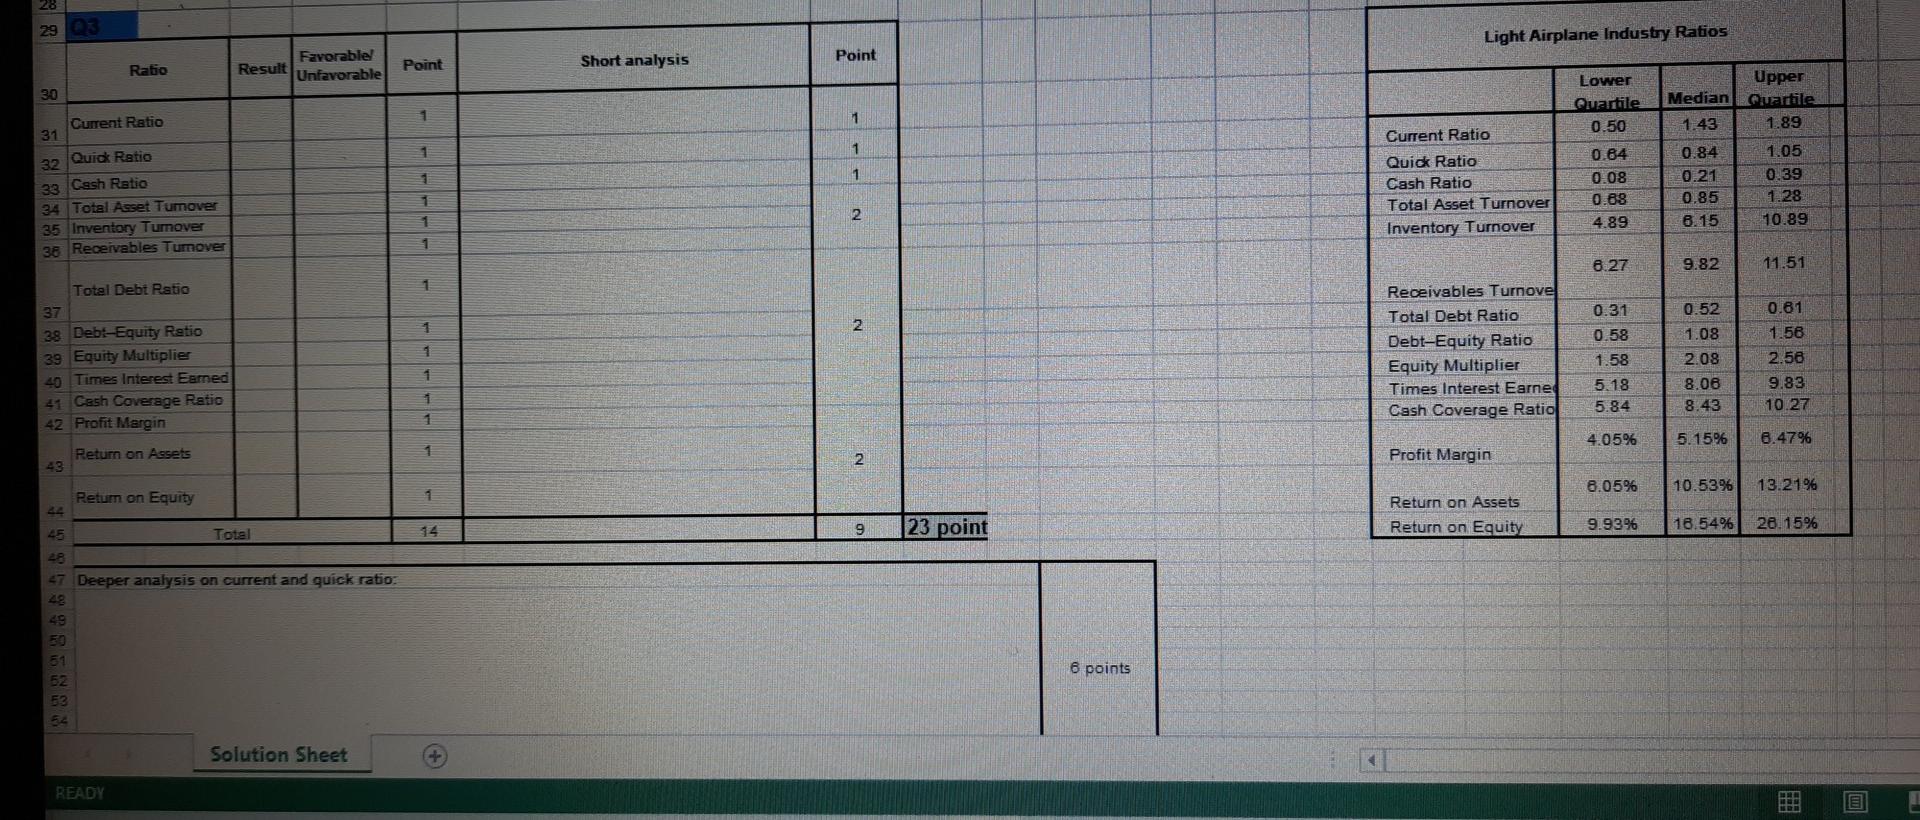
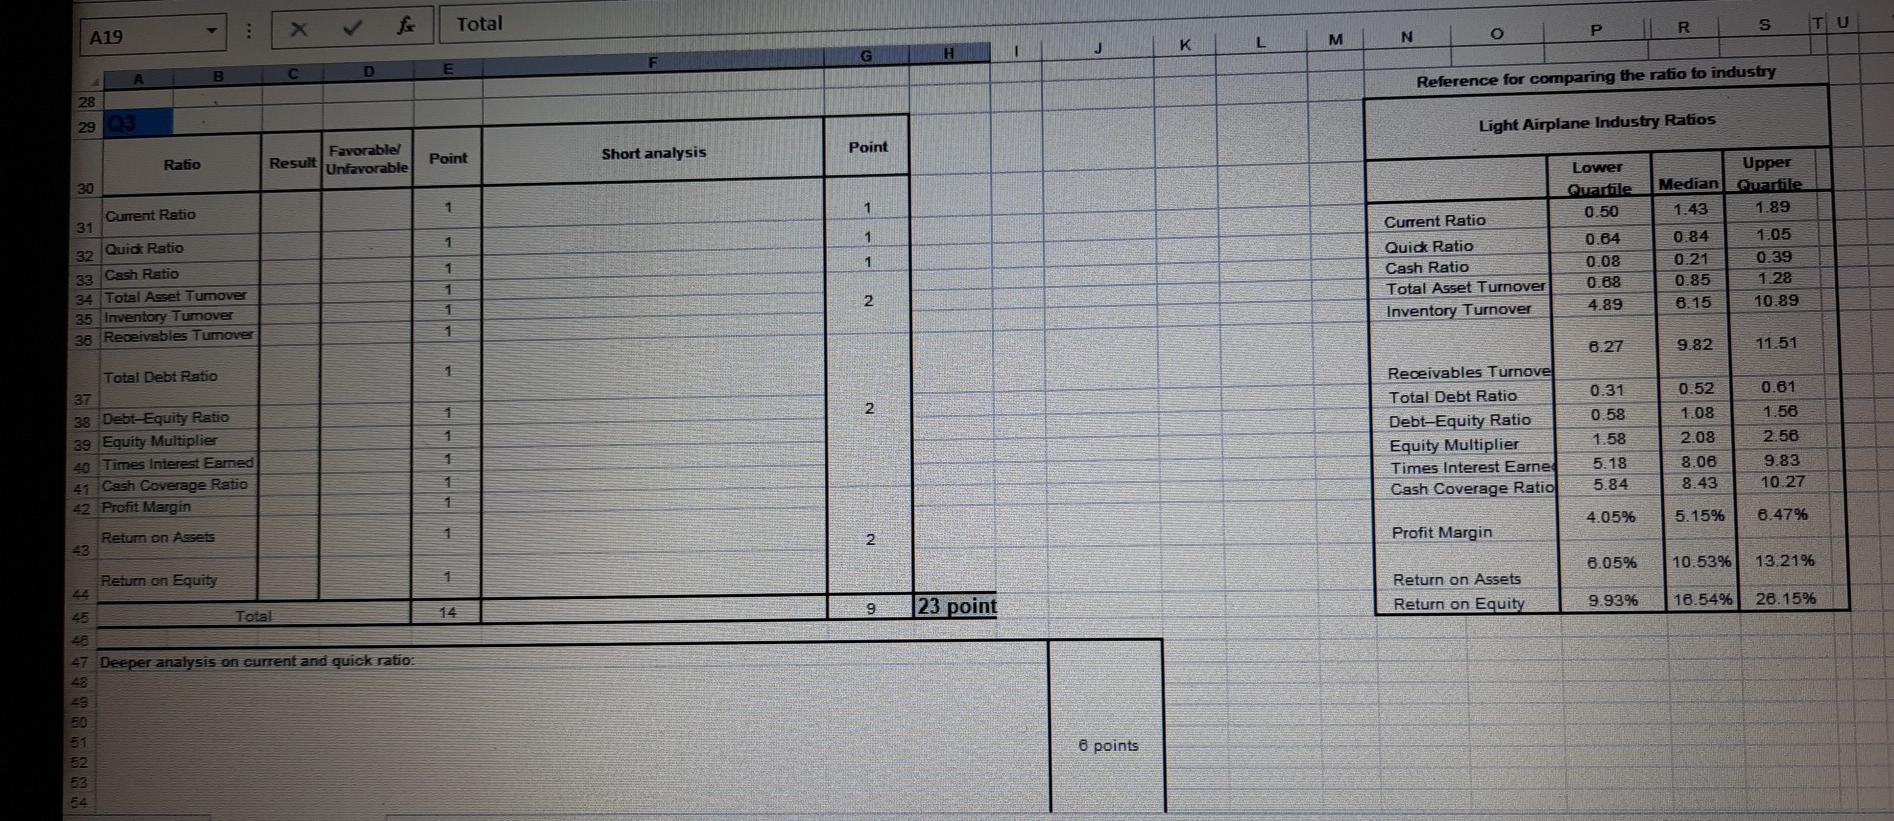
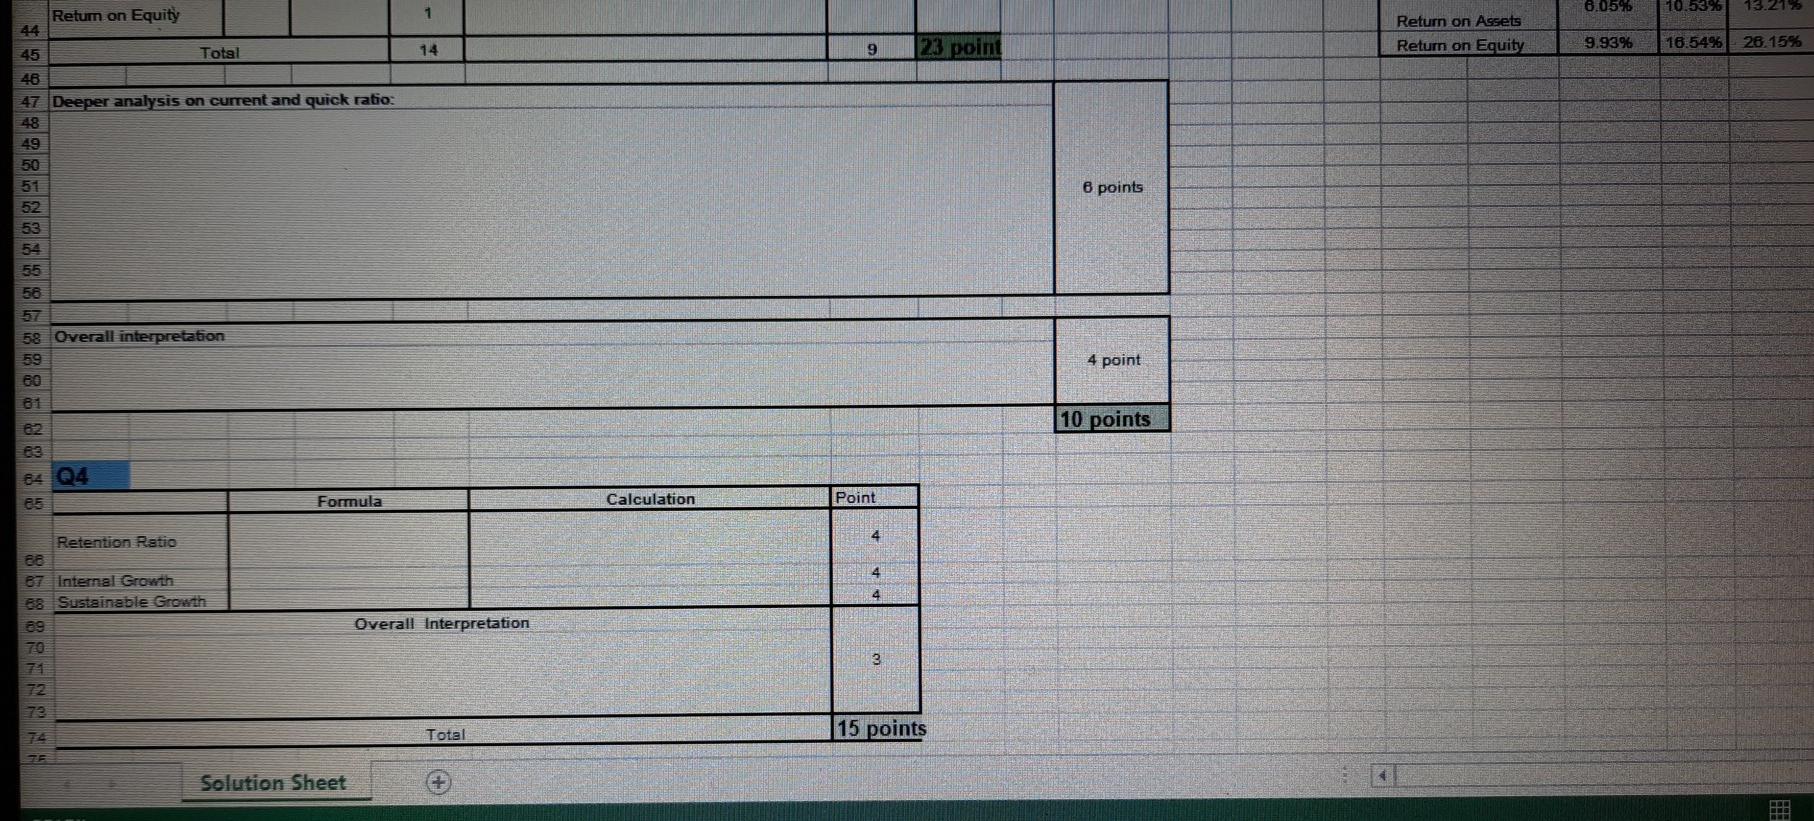
Ratlos and Elnanclal Plannlng at SRS Alr. Inc. Chris Guthrie was recently hired by S&S Alr. Inc., to assist the company with its financlal planning and to evaluate the company's perfomance. Chris graduated from college five years ago with a finance degree. He has been employed in the finance departments afortune 500 company since then. SSA was founded 10 years ago by friends Mark Sexton and Todd Story. The company has manufactured and sold light airplanes over this period, and the company's products have received high reviews for safety and rellability. The company has a niche market in that it sells primarily to individuals who own and fly their own airplanes. The company has two models: the Birdie, whoses for $53.000, and the Eagle. which sells for $78.000. While the company manufactures alrcraft, Its operations are different from commercial aircraft companies. S&S Air builds aircraft to order By using prefabricated parts. the company is able to complete the manufacture of an alrplane in only five weeks. The company receives a deposit on each order, as well as another partial payment before the order is complete. In contrast, a commercseplane may lake one and one-half to two years to manufacture once the order is placed. Mark and Tood have provided the following financial statements. Chris has gathered the industry ratios for the light alrplane S&S NIR. ING. 2019 Income Statement S&S AIR, INC. 2019 Income Statement Sales $26,501,600 Cost of goods sold 19.780,200 Other expenses 3.166,700 Depreciation 864,500 EBIT $ 2,690,200 Interest 479.200 Taxable income 2,211,000 Taxes (21%) 464.310 Net income $ 1.746,690 Dividends $270.600 Additions to retained earnings 1.476,090 QUESTIONS 1. Calculate the ratios for S&S Alr that are shown for the industry. 2. Mark and Todd agree that a ratio analysis can provide a measure of the company's performance. They have chosen Boeing as an aspirant company. Would you choose Boeing as an aspirant company? Why or why not? 3. Compare the performance of S&S Alr to the Industry. For each ratlo, comment on why It might be viewed as positive or negative relative to the industry. Suppose you create an inventory ratio calculated by Inventory divided by current liabilities. How do you think S&S Alr's ratio would compare to the industry average? 4. Calculate the internal growth rate and sustainable growth rate for S&S All What do these numbers mean? 1 FIN220 Marking rubrics Name: 2 Shuden ID 3 Q1 Section No: 4 Formula Unit Result Point Point 1 1 1 8 9 1 1 Ratio Current Ratio Quick Ratio fesh Ratio Total Asset Tumover Inventery Turnover Receivables Turnove Total Debt Ratio Debt-Equity Ratio Equity Multiplier Times Interest Esme Cash Coverage Retid Profit Margin Return on Assets Return on Equity Point 1 1 1 1 1 1 1 1 1 1 1 1 1 1 1 11 1 1 1 1 1 1 1 18 1 1 1 Total 14 14 14 42 point 20 22 Q2 23 24 10 point 27 29 3 Light Airplane Industry Ratios Favorable! Point Ratio Result Unfavorable Short analysis Point 30 Lower Quartile 0.50 Upper Median Quartile 1.43 1.89 Current Ratio 1 31 1 1 Quick Ratio 32 33 Cash Ratio 34 Total Asset Tumover 35 Inventory Turnover 38 Receivables Turnover Current Ratio Quick Ratio Cash Ratio Total Asset Turnover Inventory Turnover 0.84 0.08 0.88 4.89 0.84 0.21 0.85 6.15 1.05 0.39 1.28 10.89 2 6.27 9.82 11.51 1 0.52 1 2 1 Total Debt Ratio 37 38 Debt-Equity Ratio 39 Equity Multiplier 40 Times Interest Eemned 21 Cash Coverage Ratio 42 Profit Margin Receivables Turnove Total Debt Ratio Debt-Equity Ratio Equity Multiplier Times Interest Earne Cash Coverage Ratio 0.31 0.58 1.58 5.18 5.84 1.08 2.08 0.81 1.58 2.58 9.83 10.27 1 8.06 1 8.43 1 4.05% 5.15% 6.47% 1 Return on Assets 43 2 Profit Margin 8.05% 10.5396 13.21% Return on Equity 1 Return on Assets Return on Equity 9. 23 point 9.93% 16.54% 28.15% 45 Total 28 47 Deeper analysis on current and quick ratio: 6 points 51 52 53 54 Solution Sheet READY : X fr Total P R S A19 TU N L M K J 1 H D E A Reference for comparing the ratio to industry 28 293 Light Airplane Industry Ratios Point Short analysis Point Favorable Result Unfavorable Ratio 30 Median 1.43 Upper Quartile 1.89 1 Current Ratio 1 Current Ratio 31 Quick Ratio 32 33 Cesh Ratio 34 Total Asset Tumover 35 Inventory Tumover 38 Receivables Tumover 1 Lower Quartile 0.50 0.84 0.08 0.88 4.89 - - - - - Quick Ratio Cash Ratio Total Asset Turnover Inventory Turnover 0.84 0.21 0.85 6.15 1.05 0.39 1.28 10.89 1 1 2 6.27 9.82 11.51 1 2 Total Debt Ratio 37 38 Debt-Equity Ratio 39 Equity Multiplier 40 Times Interest Eemned 41 Cash Coverage Ratio 42 Profit Margin ----- Receivables Turnove Total Debt Ratio Debt-Equity Ratio Equity Multiplier Times Interest Earnes Cash Coverage Ratio 0.31 0.58 1.58 5.18 5.84 0.52 1.08 2.08 8.08 8.43 0.81 1.58 2.58 9.83 10.27 4.05% 5.15% 8.47% Return on Assets Profit Margin 2. 8.05% 10.5396 13.2196 1 Return on Assets Return on Equity 9.93% 23 point 16.54% 14 26.15% 9 Petum on Equity 42 Total 26 47 Deeper analysis on current and quick ratio: 8 points 51 52 52 54 0.05% 1 15.21 Return on Equity 10.53% Return on Assets Return on Equity 14 9 23 point 28.15% 9.93% 18.5496 Total 46 47 Deeper analysis on current and quick ratio: 49 50 6 points 53 58 58 Overall interpretation 4 point 10 points 64 Q4 Formula Calculation Point 4 SNONN889 98 8 8 8 R 9 88 4 Retention Ratio ea 67 Internal Growth B8 Sustainable Growth 89 4 Overall Interpretation 3 32 Total 15 points Solution Sheet Ratlos and Elnanclal Plannlng at SRS Alr. Inc. Chris Guthrie was recently hired by S&S Alr. Inc., to assist the company with its financlal planning and to evaluate the company's perfomance. Chris graduated from college five years ago with a finance degree. He has been employed in the finance departments afortune 500 company since then. SSA was founded 10 years ago by friends Mark Sexton and Todd Story. The company has manufactured and sold light airplanes over this period, and the company's products have received high reviews for safety and rellability. The company has a niche market in that it sells primarily to individuals who own and fly their own airplanes. The company has two models: the Birdie, whoses for $53.000, and the Eagle. which sells for $78.000. While the company manufactures alrcraft, Its operations are different from commercial aircraft companies. S&S Air builds aircraft to order By using prefabricated parts. the company is able to complete the manufacture of an alrplane in only five weeks. The company receives a deposit on each order, as well as another partial payment before the order is complete. In contrast, a commercseplane may lake one and one-half to two years to manufacture once the order is placed. Mark and Tood have provided the following financial statements. Chris has gathered the industry ratios for the light alrplane S&S NIR. ING. 2019 Income Statement S&S AIR, INC. 2019 Income Statement Sales $26,501,600 Cost of goods sold 19.780,200 Other expenses 3.166,700 Depreciation 864,500 EBIT $ 2,690,200 Interest 479.200 Taxable income 2,211,000 Taxes (21%) 464.310 Net income $ 1.746,690 Dividends $270.600 Additions to retained earnings 1.476,090 QUESTIONS 1. Calculate the ratios for S&S Alr that are shown for the industry. 2. Mark and Todd agree that a ratio analysis can provide a measure of the company's performance. They have chosen Boeing as an aspirant company. Would you choose Boeing as an aspirant company? Why or why not? 3. Compare the performance of S&S Alr to the Industry. For each ratlo, comment on why It might be viewed as positive or negative relative to the industry. Suppose you create an inventory ratio calculated by Inventory divided by current liabilities. How do you think S&S Alr's ratio would compare to the industry average? 4. Calculate the internal growth rate and sustainable growth rate for S&S All What do these numbers mean? 1 FIN220 Marking rubrics Name: 2 Shuden ID 3 Q1 Section No: 4 Formula Unit Result Point Point 1 1 1 8 9 1 1 Ratio Current Ratio Quick Ratio fesh Ratio Total Asset Tumover Inventery Turnover Receivables Turnove Total Debt Ratio Debt-Equity Ratio Equity Multiplier Times Interest Esme Cash Coverage Retid Profit Margin Return on Assets Return on Equity Point 1 1 1 1 1 1 1 1 1 1 1 1 1 1 1 11 1 1 1 1 1 1 1 18 1 1 1 Total 14 14 14 42 point 20 22 Q2 23 24 10 point 27 29 3 Light Airplane Industry Ratios Favorable! Point Ratio Result Unfavorable Short analysis Point 30 Lower Quartile 0.50 Upper Median Quartile 1.43 1.89 Current Ratio 1 31 1 1 Quick Ratio 32 33 Cash Ratio 34 Total Asset Tumover 35 Inventory Turnover 38 Receivables Turnover Current Ratio Quick Ratio Cash Ratio Total Asset Turnover Inventory Turnover 0.84 0.08 0.88 4.89 0.84 0.21 0.85 6.15 1.05 0.39 1.28 10.89 2 6.27 9.82 11.51 1 0.52 1 2 1 Total Debt Ratio 37 38 Debt-Equity Ratio 39 Equity Multiplier 40 Times Interest Eemned 21 Cash Coverage Ratio 42 Profit Margin Receivables Turnove Total Debt Ratio Debt-Equity Ratio Equity Multiplier Times Interest Earne Cash Coverage Ratio 0.31 0.58 1.58 5.18 5.84 1.08 2.08 0.81 1.58 2.58 9.83 10.27 1 8.06 1 8.43 1 4.05% 5.15% 6.47% 1 Return on Assets 43 2 Profit Margin 8.05% 10.5396 13.21% Return on Equity 1 Return on Assets Return on Equity 9. 23 point 9.93% 16.54% 28.15% 45 Total 28 47 Deeper analysis on current and quick ratio: 6 points 51 52 53 54 Solution Sheet READY : X fr Total P R S A19 TU N L M K J 1 H D E A Reference for comparing the ratio to industry 28 293 Light Airplane Industry Ratios Point Short analysis Point Favorable Result Unfavorable Ratio 30 Median 1.43 Upper Quartile 1.89 1 Current Ratio 1 Current Ratio 31 Quick Ratio 32 33 Cesh Ratio 34 Total Asset Tumover 35 Inventory Tumover 38 Receivables Tumover 1 Lower Quartile 0.50 0.84 0.08 0.88 4.89 - - - - - Quick Ratio Cash Ratio Total Asset Turnover Inventory Turnover 0.84 0.21 0.85 6.15 1.05 0.39 1.28 10.89 1 1 2 6.27 9.82 11.51 1 2 Total Debt Ratio 37 38 Debt-Equity Ratio 39 Equity Multiplier 40 Times Interest Eemned 41 Cash Coverage Ratio 42 Profit Margin ----- Receivables Turnove Total Debt Ratio Debt-Equity Ratio Equity Multiplier Times Interest Earnes Cash Coverage Ratio 0.31 0.58 1.58 5.18 5.84 0.52 1.08 2.08 8.08 8.43 0.81 1.58 2.58 9.83 10.27 4.05% 5.15% 8.47% Return on Assets Profit Margin 2. 8.05% 10.5396 13.2196 1 Return on Assets Return on Equity 9.93% 23 point 16.54% 14 26.15% 9 Petum on Equity 42 Total 26 47 Deeper analysis on current and quick ratio: 8 points 51 52 52 54 0.05% 1 15.21 Return on Equity 10.53% Return on Assets Return on Equity 14 9 23 point 28.15% 9.93% 18.5496 Total 46 47 Deeper analysis on current and quick ratio: 49 50 6 points 53 58 58 Overall interpretation 4 point 10 points 64 Q4 Formula Calculation Point 4 SNONN889 98 8 8 8 R 9 88 4 Retention Ratio ea 67 Internal Growth B8 Sustainable Growth 89 4 Overall Interpretation 3 32 Total 15 points Solution Sheet
Step by Step Solution
There are 3 Steps involved in it
Step: 1

Get Instant Access to Expert-Tailored Solutions
See step-by-step solutions with expert insights and AI powered tools for academic success
Step: 2

Step: 3
Ace Your Homework with AI
Get the answers you need in no time with our AI-driven, step-by-step assistance
Get Started
Advanced Models And Tools For Effective Decision Making Under Uncertainty And Risk Contexts
Authors: Vicente González-Prida, María Carmen Carnero
1st Edition
1799832465,179983249X