

Answered step by step
Verified Expert Solution
Question
1 Approved Answer
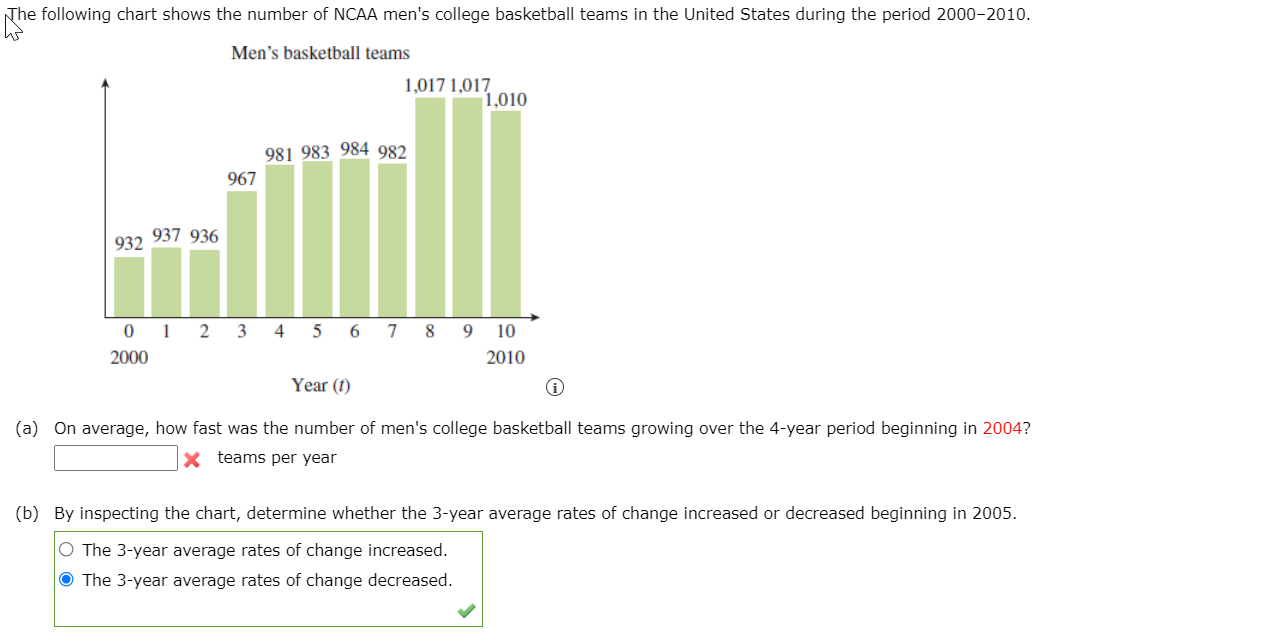
re following chart shows the number of NCAA men's college basketball teams in the United States during the period 200020 10. Men's butane teams 131713171310

Step by Step Solution
There are 3 Steps involved in it
Step: 1

Get Instant Access to Expert-Tailored Solutions
See step-by-step solutions with expert insights and AI powered tools for academic success
Step: 2

Step: 3
Ace Your Homework with AI
Get the answers you need in no time with our AI-driven, step-by-step assistance
Get Started
Mathematical Analysis And Its Applications Roorkee, India, December 2014
Authors: P N Agrawal, R N Mohapatra, Uaday Singh, H M Srivastava
1st Edition
813222485X, 9788132224853