

Question
Re Question: In this task, you are required to classify the data into one of the... - In the above, let us imagine we have
 Re Question: In this task, you are required to classify the data into one of the... -
In the above, let us imagine we have used eight variables (attributes from column 2 to column 9) as the independent variables of the target variable. The question here is how to remove some independent variables to make the decision tree simple. Usually, we expect that the dimensionality reduction does not reduce the performance significantly. How to provide a method to remove a few variables (at least two, more is better) from column 2 to column 9?
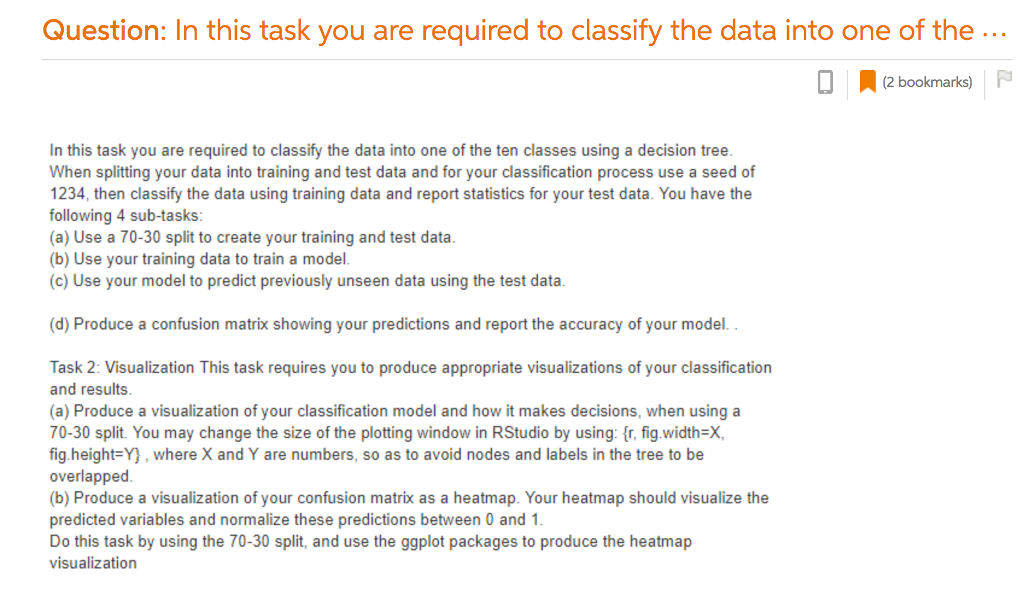
Question: In this task you are required to classify the data into one of the (2 bookmarks) In this task you are required to classify the data into one of the ten classes using a decision tree When splitting your data into training and test data and for your classification process use a seed of 234, then classify the data using training data and report statistics for your test data. You have the following 4 sub-tasks (a) Use a 70-30 split to create your training and test data. (b) Use your training data to train a model. c) Use your model to predict previously unseen data using the test data. (d) Produce a confusion matrix showing your predictions and report the accuracy of your model. Task 2: Visualization This task requires you to produce appropriate visualizations of your classification and results (a) Produce a visualization of your classification model and how it makes decisions, when using a 70-30 split. You may change the size of the plotting window in RStudio by using: r, fig.width-X fig.height-Y), where X and Y are numbers, so as to avoid nodes and labels in the tree to be overlapped. (b) Produce a visualization of your confusion matrix as a heatmap. Your heatmap should visualize the predicted variables and normalize these predictions between 0 and 1 Do this task by using the 70-30 split, and use the ggplot packages to produce the heatmap visualizationStep by Step Solution
There are 3 Steps involved in it
Step: 1

Get Instant Access to Expert-Tailored Solutions
See step-by-step solutions with expert insights and AI powered tools for academic success
Step: 2

Step: 3
Ace Your Homework with AI
Get the answers you need in no time with our AI-driven, step-by-step assistance
Get Started
Spomenik Monument Database
Authors: Donald Niebyl, FUEL, Damon Murray, Stephen Sorrell
1st Edition
0995745536, 978-0995745537