Question
Read Mattel Incorporated in 2019: Hard Times in the Toy Industry (Case 7 in Textbook) Complete the Mattel Incorporated Spreadsheet with your calculations of the
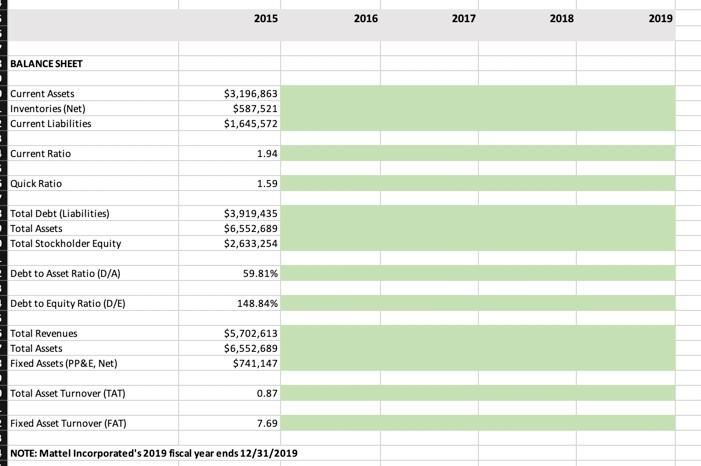
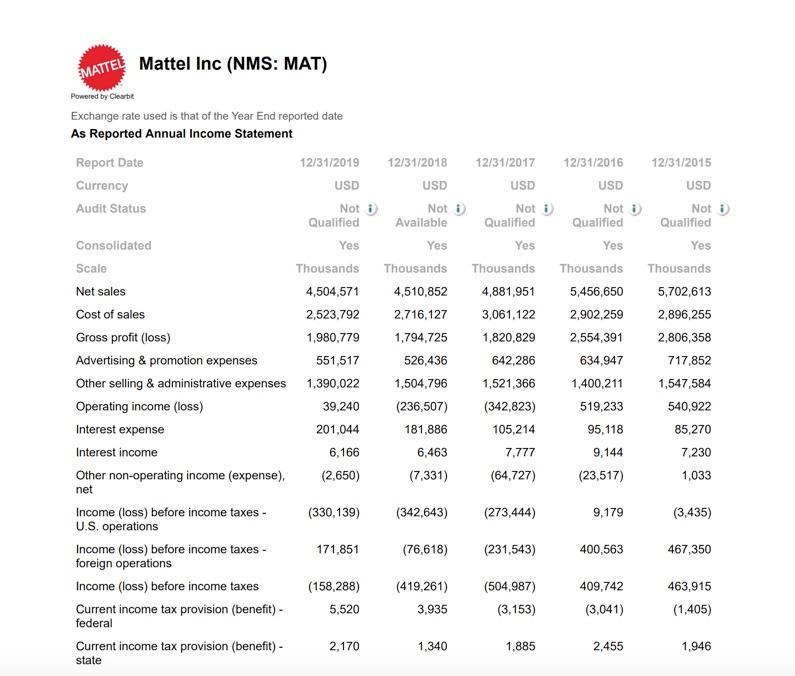
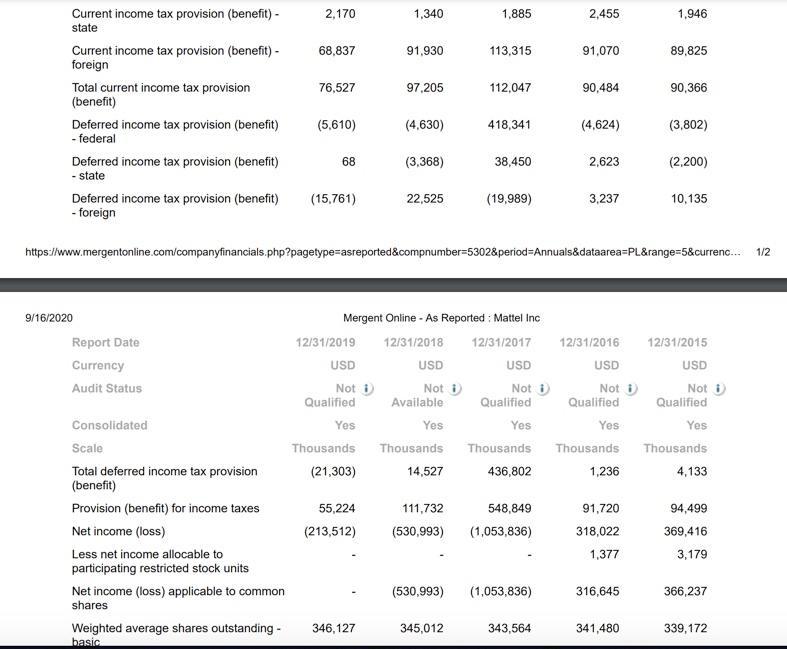
Read “Mattel Incorporated in 2019: Hard Times in the Toy Industry” (Case 7 in Textbook) Complete the Mattel Incorporated Spreadsheet with your calculations of the indicated (green boxes) financial ratios. Calculate your financial ratios for the spreadsheet from the PDF files of the company’s Income Statements and Balance Sheets for 2015-2019 attached to this unit on Blackboard (Mergent Online Financial Statements). NOTE: Use the “Commonly Used Financial Ratios” PDF file formulas for the financial ratio calculations. TIP: Use n=4 in your CAGR calculation. NOTE: Use the Net Income (Loss) per share – diluted as the answer for the EPS (diluted) line on your spreadsheet. NOTE: Total Debt (Liabilities) can be calculated two ways: (1) Total Current Liabilities line PLUS Total Noncurrent Liabilities line. OR (2) Total Assets line MINUS Total Stockholder’s Equity line.
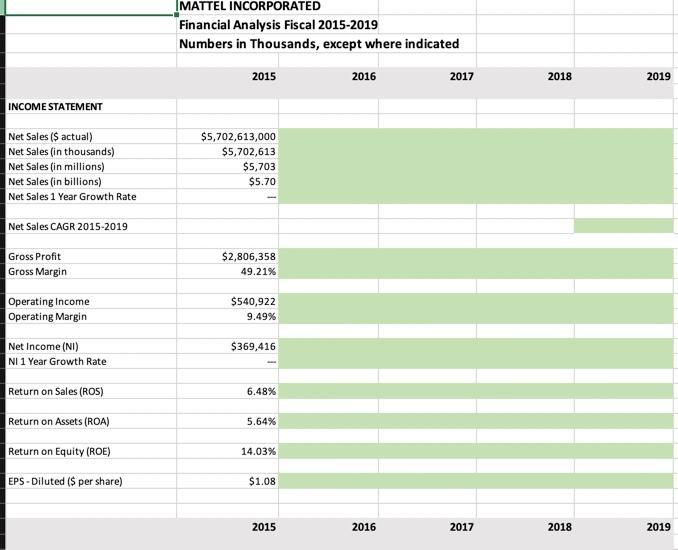
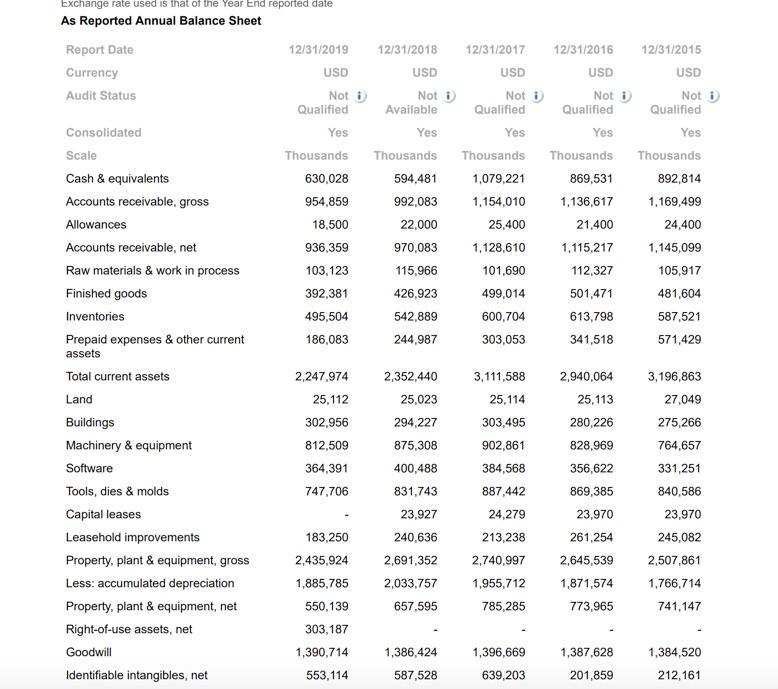
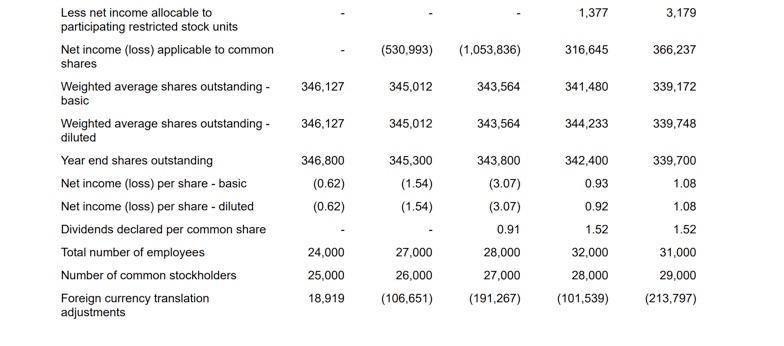
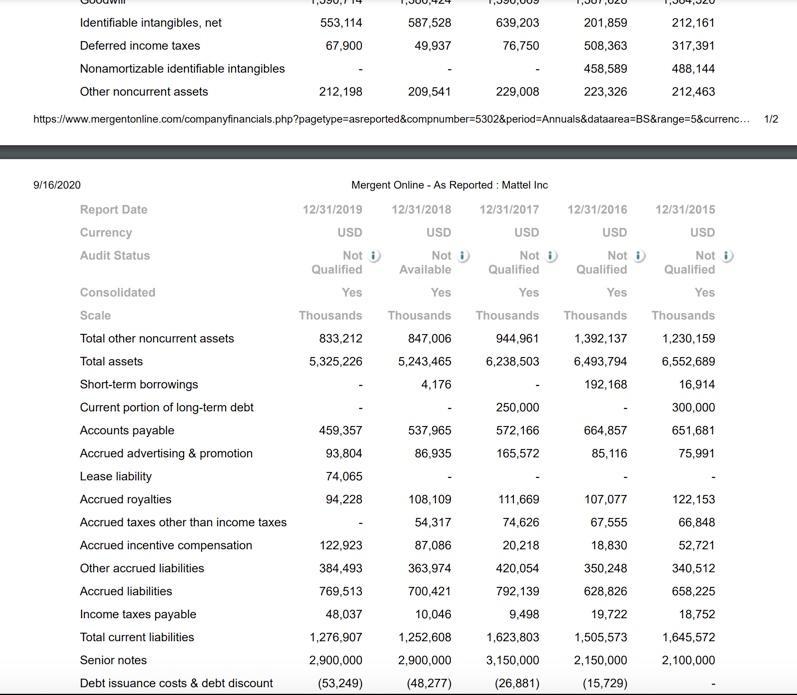
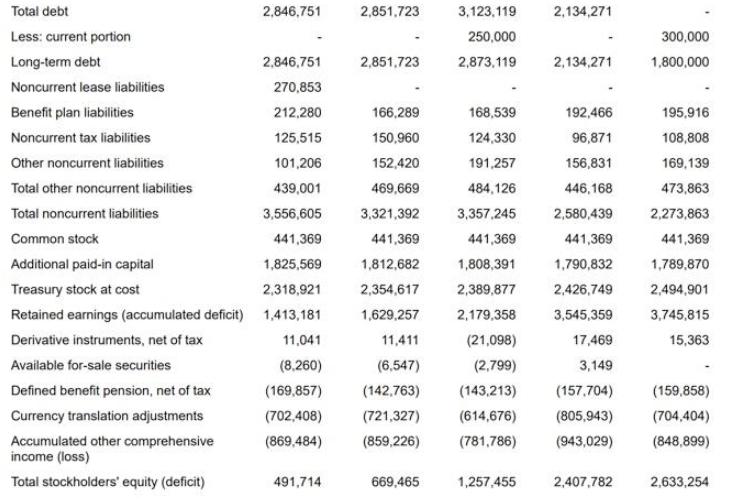
MATTEL INCORPORATED Financial Analysis Fiscal 2015-2019 Numbers in Thousands, except where indicated 2015 2016 2017 2018 2019 INCOME STATEMENT Net Sales (S actual) Net Sales (in thousands) Net Sales (in millions) Net Sales (in billions) $5,702,613,000 $5,702,613 $5,703 $5.70 Net Sales 1 Year Growth Rate Net Sales CAGR 2015-2019 Gross Profit $2,806,358 Gross Margin 49.21% Operating Income $540,922 Operating Margin 9.49% Net Income (NI) NI 1 Year Growth Rate $369,416 Return on Sales (ROS) 6.48% Return on Assets (ROA) 5.64% Return on Equity (ROE) 14.03% EPS - Diluted ($ per share) $1.08 2015 2016 2017 2018 2019
Step by Step Solution
3.41 Rating (160 Votes )
There are 3 Steps involved in it
Step: 1

Get Instant Access to Expert-Tailored Solutions
See step-by-step solutions with expert insights and AI powered tools for academic success
Step: 2

Step: 3

Ace Your Homework with AI
Get the answers you need in no time with our AI-driven, step-by-step assistance
Get Started


