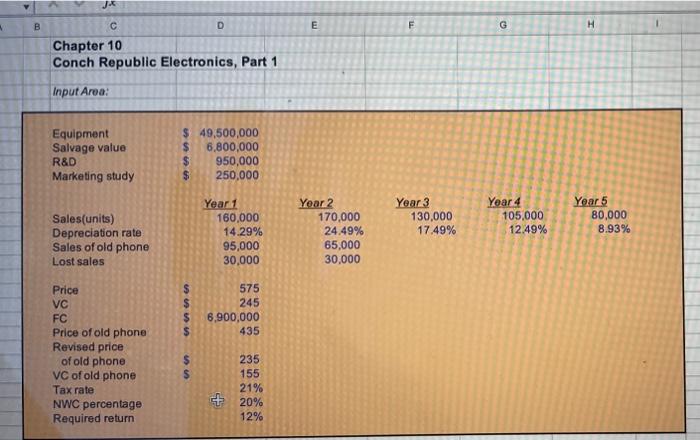
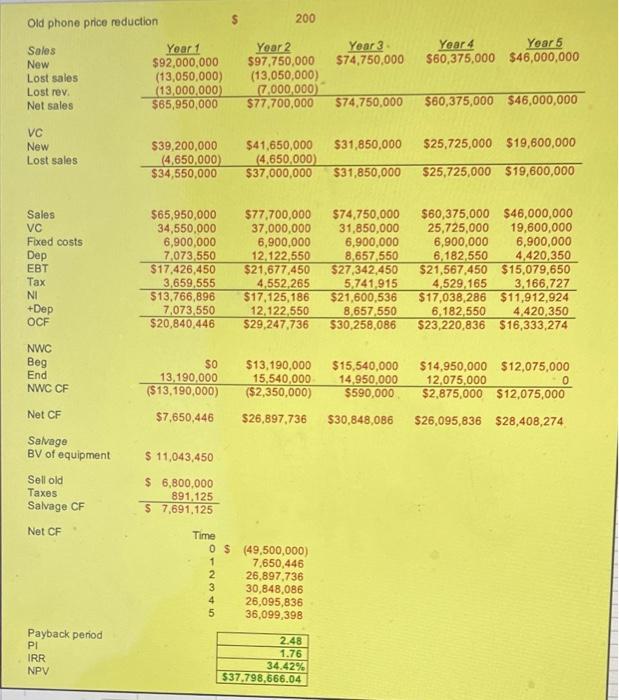
Read "Minicase: Conch Republic Electronics" in Chapter 10 (Part 1) and Chapter 11 (Part 2). The attached Excel spreadsheet already solves Part 1. Your task is to solve the questions raised in Part 2. You need to duplicate the Excel tables in Part 1 and conduct the sensitivity analysis of NPV to changes in the following: 1. Price of the new smart phone increases from $575 to $580. 2. The sale quantity of the new smart phone increases by 100 units. Upload your Excel file here before the deadline. JK B E F G D Chapter 10 Conch Republic Electronics, Part 1 Input Area: Equipment Salvage value R&D Marketing study $ 49,500,000 $ 6,800,000 $ 950,000 $ 250,000 Year 1 160,000 14.29% 95,000 30,000 Year 2 170,000 24.49% 65,000 30,000 Year 3 130,000 17.49% Year 4 105,000 12.49% Sales(units) Depreciation rate Sales of old phone Lost sales Year 5 80,000 8.93% $ $ $ $ 575 245 6,900,000 435 Price VC FC Price of old phone Revised price of old phone VC of old phone Tax rate NWC percentage Required return $ $ 235 155 21% + 20% 12% Old phone price reduction 200 Year 3 $74,750,000 Year 4 Yoar 5 $60,375,000 $46,000,000 Sales New Lost sales Lost rev Net sales Year 1 $92,000,000 (13,050,000) 13,000,000) $65,950,000 Year 2 $97,750,000 (13,050,000) 7,000,000 $77,700,000 574,750,000 $60,375,000 $46,000,000 VC New Lost sales $31,850,000 $25,725,000 $19,600,000 $39,200,000 (4,650,000) $34,550,000 $41,650,000 (4,650,000) $37,000,000 $31,850,000 $25,725,000 $19,600,000 Sales VC Fixed costs Dep EBT Tax NI +Dep OCF $65,950,000 34,550,000 6,900,000 7,073,550 $17,426,450 3,659,555 $13,766,896 7,073,550 $20,840,446 $77.700,000 37,000,000 6,900,000 12,122,550 $21,677,450 4,552,265 $17,125,186 12.122,550 $29,247,736 $74,750,000 31,850,000 6,900,000 8,657,550 $27,342,450 5,741,915 $21,600,536 8,657,550 $30,258,086 $60,375,000 $46,000,000 25,725,000 19,600,000 6,900,000 6,900,000 6,182,550 4,420,350 $21,567,450 $15,079,650 4,529,165 3.166.727 $17,038,286 $11,912,924 6,182,550 4,420,350 $23,220,836 $16,333,274 NWC Beg End NWC CF $o 13,190,000 ($13,190,000) $13,190,000 15,540,000 ($2,350,000) $15,540,000 14,950,000 $590,000 $14.950,000 $12,075,000 12.075,000 0 $2.875,000 $12,075,000 Net CF $7,650,446 $26,897,736 $30,848,086 $26,095,836 $28,408,274 Salvage BV of equipment $ 11,043,450 Sell old Taxes Salvage CF $ 6,800,000 891,125 $ 7,691.125 Net CF Time 0 $ (49,500,000) 1 7,650,446 2 26.897,736 3 30.848,086 4 26,095,836 5 36,099,398 Payback period PI IRR NPV 2.48 1.76 34.42% 537.798,666.04 Read "Minicase: Conch Republic Electronics" in Chapter 10 (Part 1) and Chapter 11 (Part 2). The attached Excel spreadsheet already solves Part 1. Your task is to solve the questions raised in Part 2. You need to duplicate the Excel tables in Part 1 and conduct the sensitivity analysis of NPV to changes in the following: 1. Price of the new smart phone increases from $575 to $580. 2. The sale quantity of the new smart phone increases by 100 units. Upload your Excel file here before the deadline. JK B E F G D Chapter 10 Conch Republic Electronics, Part 1 Input Area: Equipment Salvage value R&D Marketing study $ 49,500,000 $ 6,800,000 $ 950,000 $ 250,000 Year 1 160,000 14.29% 95,000 30,000 Year 2 170,000 24.49% 65,000 30,000 Year 3 130,000 17.49% Year 4 105,000 12.49% Sales(units) Depreciation rate Sales of old phone Lost sales Year 5 80,000 8.93% $ $ $ $ 575 245 6,900,000 435 Price VC FC Price of old phone Revised price of old phone VC of old phone Tax rate NWC percentage Required return $ $ 235 155 21% + 20% 12% Old phone price reduction 200 Year 3 $74,750,000 Year 4 Yoar 5 $60,375,000 $46,000,000 Sales New Lost sales Lost rev Net sales Year 1 $92,000,000 (13,050,000) 13,000,000) $65,950,000 Year 2 $97,750,000 (13,050,000) 7,000,000 $77,700,000 574,750,000 $60,375,000 $46,000,000 VC New Lost sales $31,850,000 $25,725,000 $19,600,000 $39,200,000 (4,650,000) $34,550,000 $41,650,000 (4,650,000) $37,000,000 $31,850,000 $25,725,000 $19,600,000 Sales VC Fixed costs Dep EBT Tax NI +Dep OCF $65,950,000 34,550,000 6,900,000 7,073,550 $17,426,450 3,659,555 $13,766,896 7,073,550 $20,840,446 $77.700,000 37,000,000 6,900,000 12,122,550 $21,677,450 4,552,265 $17,125,186 12.122,550 $29,247,736 $74,750,000 31,850,000 6,900,000 8,657,550 $27,342,450 5,741,915 $21,600,536 8,657,550 $30,258,086 $60,375,000 $46,000,000 25,725,000 19,600,000 6,900,000 6,900,000 6,182,550 4,420,350 $21,567,450 $15,079,650 4,529,165 3.166.727 $17,038,286 $11,912,924 6,182,550 4,420,350 $23,220,836 $16,333,274 NWC Beg End NWC CF $o 13,190,000 ($13,190,000) $13,190,000 15,540,000 ($2,350,000) $15,540,000 14,950,000 $590,000 $14.950,000 $12,075,000 12.075,000 0 $2.875,000 $12,075,000 Net CF $7,650,446 $26,897,736 $30,848,086 $26,095,836 $28,408,274 Salvage BV of equipment $ 11,043,450 Sell old Taxes Salvage CF $ 6,800,000 891,125 $ 7,691.125 Net CF Time 0 $ (49,500,000) 1 7,650,446 2 26.897,736 3 30.848,086 4 26,095,836 5 36,099,398 Payback period PI IRR NPV 2.48 1.76 34.42% 537.798,666.04


