Read the Chapter 9 Case Exercise: Cost Functions. Using the information, write a 1-3 page paper which addresses Exercise Questions 2 through 6, and 8.
Introduction : Introduce, describe, and/or provide context for the business case (5 points)
Exercise Questions 2-4 : Assume you already possess all the information in question 2. Using that information, describe the regression equation, each variable in the equation, the relative importance of each variable both in terms of its statistical significance and its impact on total costs, and one or two key variables which have the greatest impact on total costs for charter schools in Wisconsin. (25 points)
Exercise Questions 5, 6, 8 : Provide the equation for the partial derivative C/Q and indicate the number of students that minimizes total costs related to enrollment (C/Q = 0). Calculate the marginal change in costs from enrollment at enrollment levels of 250, 500, 750, 1000, 1250, 1500, 1750, and 2000. Explain your findings and discuss the relevance of those findings in context to question 8. (15 points)
Conclusion : Based on your analysis, what strategy would you suggest to a new charter school? What relevance would total revenue have on your analysis? Briefly explain your reasoning. (5 points)
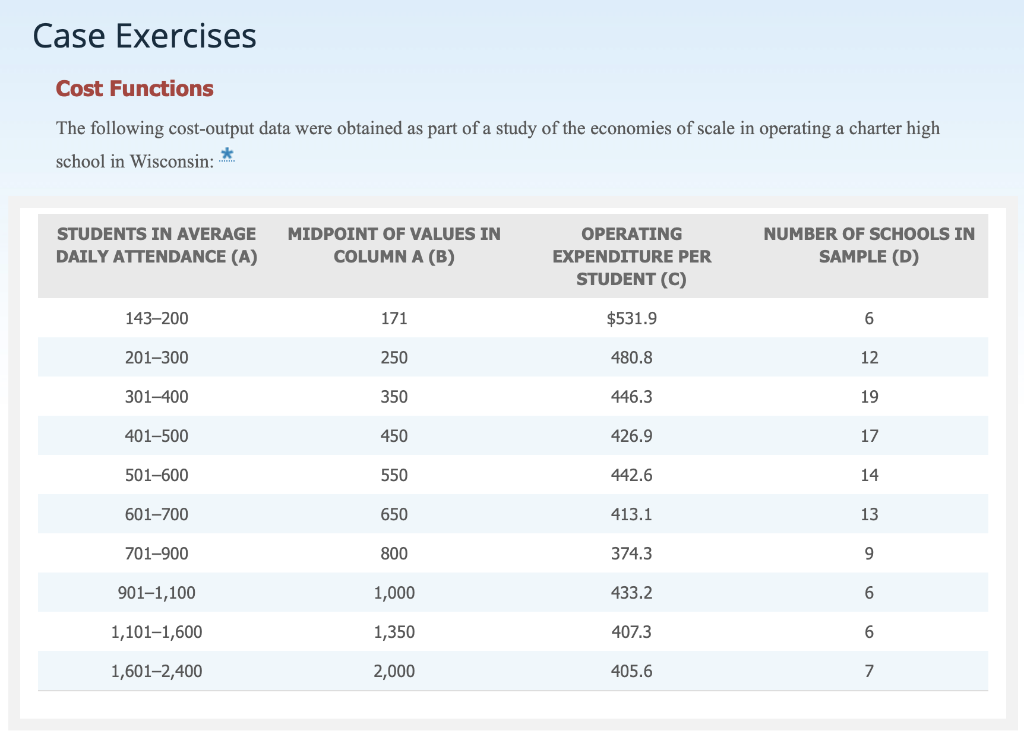
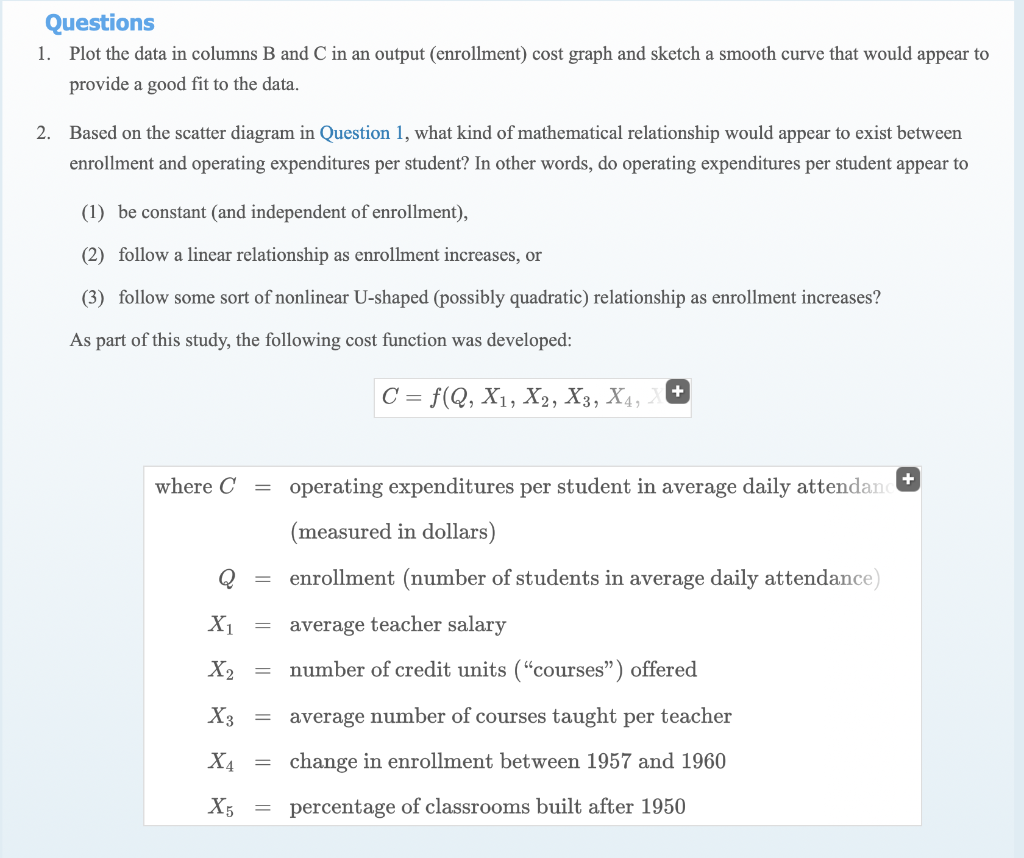
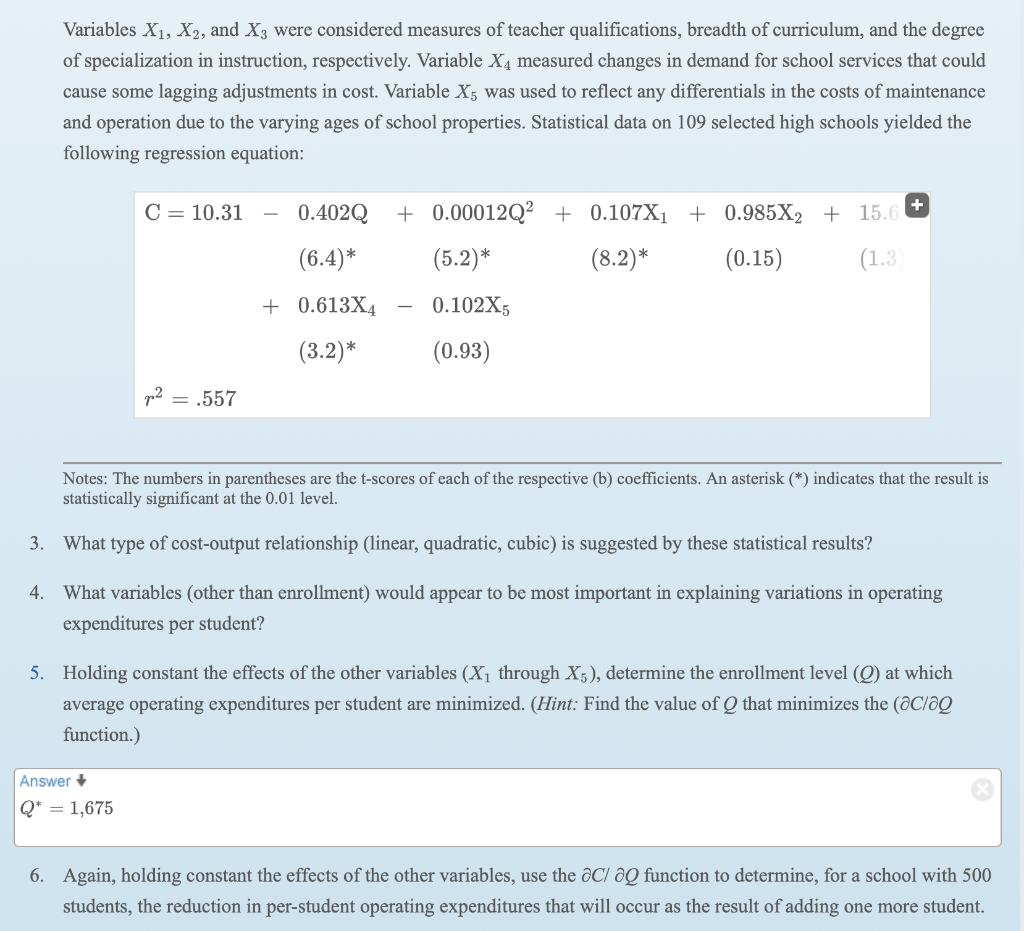
Cost Functions The following cost-output data were obtained as part of a study of the economies of scale in operating a charter high school in Wisconsin: 1. Plot the data in columns B and C in an output (enrollment) cost graph and sketch a smooth curve that would appear to provide a good fit to the data. 2. Based on the scatter diagram in Question 1, what kind of mathematical relationship would appear to exist between enrollment and operating expenditures per student? In other words, do operating expenditures per student appear to (1) be constant (and independent of enrollment), (2) follow a linear relationship as enrollment increases, or (3) follow some sort of nonlinear U-shaped (possibly quadratic) relationship as enrollment increases? As part of this study, the following cost function was developed: C=f(Q,X1,X2,X3,X4 where C= operating expenditures per student in average daily attendan (measured in dollars) Q= enrollment (number of students in average daily attendance) X1= average teacher salary X2= number of credit units ("courses") offered X3= average number of courses taught per teacher X4= change in enrollment between 1957 and 1960 X5= percentage of classrooms built after 1950 Variables X1,X2, and X3 were considered measures of teacher qualifications, breadth of curriculum, and the degree of specialization in instruction, respectively. Variable X4 measured changes in demand for school services that could cause some lagging adjustments in cost. Variable X5 was used to reflect any differentials in the costs of maintenance and operation due to the varying ages of school properties. Statistical data on 109 selected high schools yielded the following regression equation: C=10.310.402Q+(6.4)0.00012Q2+0.107X1+0.985X2+15.6+(5.2)(8.2)(0.15) +0.613X40.102X5 (3.2)(0.93) r2=.557 Notes: The numbers in parentheses are the t-scores of each of the respective (b) coefficients. An asterisk () indicates that the result is statistically significant at the 0.01 level. 3. What type of cost-output relationship (linear, quadratic, cubic) is suggested by these statistical results? 4. What variables (other than enrollment) would appear to be most important in explaining variations in operating expenditures per student? 5. Holding constant the effects of the other variables (X1 through X5), determine the enrollment level (Q) at which average operating expenditures per student are minimized. (Hint: Find the value of Q that minimizes the (C/Q function.) 6. Again, holding constant the effects of the other variables, use the C/Q function to determine, for a school with 500 students, the reduction in per-student operating expenditures that will occur as the result of adding one more student. 7. Again, holding the other variables constant, what would be the saving in perstudent operating expenditures of an increase in enrollment from 500 to 1,000 ? 8. Based on the results of this study, what can we conclude about the existence of scale and scope economies or diseconomies in operating a public high school? Cost Functions The following cost-output data were obtained as part of a study of the economies of scale in operating a charter high school in Wisconsin: 1. Plot the data in columns B and C in an output (enrollment) cost graph and sketch a smooth curve that would appear to provide a good fit to the data. 2. Based on the scatter diagram in Question 1, what kind of mathematical relationship would appear to exist between enrollment and operating expenditures per student? In other words, do operating expenditures per student appear to (1) be constant (and independent of enrollment), (2) follow a linear relationship as enrollment increases, or (3) follow some sort of nonlinear U-shaped (possibly quadratic) relationship as enrollment increases? As part of this study, the following cost function was developed: C=f(Q,X1,X2,X3,X4 where C= operating expenditures per student in average daily attendan (measured in dollars) Q= enrollment (number of students in average daily attendance) X1= average teacher salary X2= number of credit units ("courses") offered X3= average number of courses taught per teacher X4= change in enrollment between 1957 and 1960 X5= percentage of classrooms built after 1950 Variables X1,X2, and X3 were considered measures of teacher qualifications, breadth of curriculum, and the degree of specialization in instruction, respectively. Variable X4 measured changes in demand for school services that could cause some lagging adjustments in cost. Variable X5 was used to reflect any differentials in the costs of maintenance and operation due to the varying ages of school properties. Statistical data on 109 selected high schools yielded the following regression equation: C=10.310.402Q+(6.4)0.00012Q2+0.107X1+0.985X2+15.6+(5.2)(8.2)(0.15) +0.613X40.102X5 (3.2)(0.93) r2=.557 Notes: The numbers in parentheses are the t-scores of each of the respective (b) coefficients. An asterisk () indicates that the result is statistically significant at the 0.01 level. 3. What type of cost-output relationship (linear, quadratic, cubic) is suggested by these statistical results? 4. What variables (other than enrollment) would appear to be most important in explaining variations in operating expenditures per student? 5. Holding constant the effects of the other variables (X1 through X5), determine the enrollment level (Q) at which average operating expenditures per student are minimized. (Hint: Find the value of Q that minimizes the (C/Q function.) 6. Again, holding constant the effects of the other variables, use the C/Q function to determine, for a school with 500 students, the reduction in per-student operating expenditures that will occur as the result of adding one more student. 7. Again, holding the other variables constant, what would be the saving in perstudent operating expenditures of an increase in enrollment from 500 to 1,000 ? 8. Based on the results of this study, what can we conclude about the existence of scale and scope economies or diseconomies in operating a public high school