Answered step by step
Verified Expert Solution
Question
1 Approved Answer
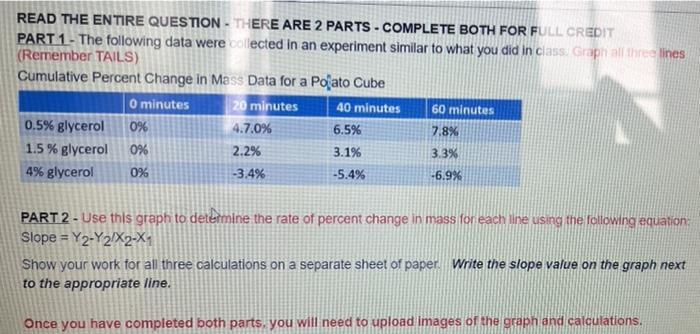
READ THE ENTIRE QUESTION THERE ARE 2 PARTS - COMPLETE BOTH FOR FULL CREDIT PART 1- The following data were collected in an experiment

READ THE ENTIRE QUESTION THERE ARE 2 PARTS - COMPLETE BOTH FOR FULL CREDIT PART 1- The following data were collected in an experiment similar to what you did in class. Graph all three lines (Remember TAILS) Cumulative Percent Change in Mass Data for a Polato Cube 20 minutes 4.7.0% 2.2% -3.4% 0 minutes 0.5% glycerol 0% 1.5% glycerol 0% 4% glycerol 0% 40 minutes 6.5% 3.1% -5.4% 60 minutes 7.8% 3.3% -6.9% PART 2- Use this graph to determine the rate of percent change in mass for each line using the following equation: Slope=Y2-Y2/X2-X Show your work for all three calculations on a separate sheet of paper. Write the slope value on the graph next to the appropriate line. Once you have completed both parts, you will need to upload images of the graph and calculations.
Step by Step Solution
★★★★★
3.53 Rating (156 Votes )
There are 3 Steps involved in it
Step: 1
Part 1 Answer ...
Get Instant Access to Expert-Tailored Solutions
See step-by-step solutions with expert insights and AI powered tools for academic success
Step: 2

Step: 3

Ace Your Homework with AI
Get the answers you need in no time with our AI-driven, step-by-step assistance
Get Started


