

Question
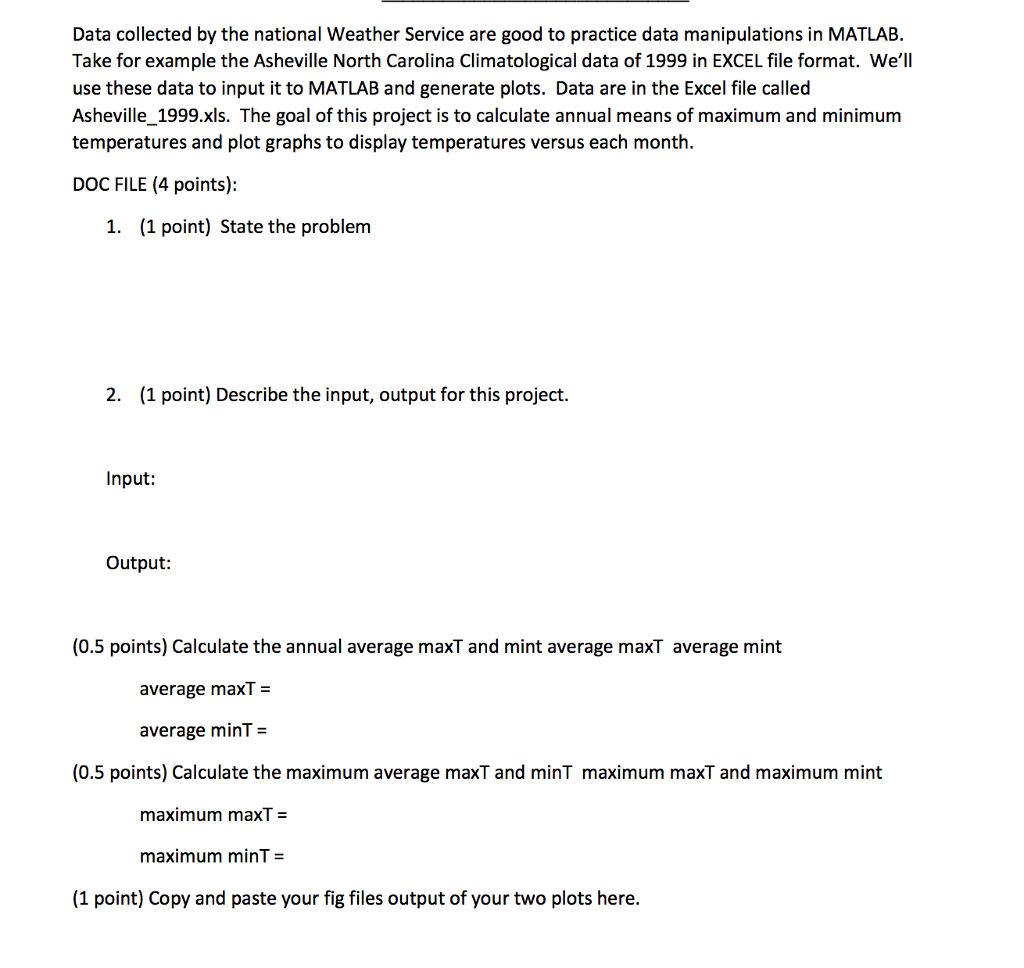
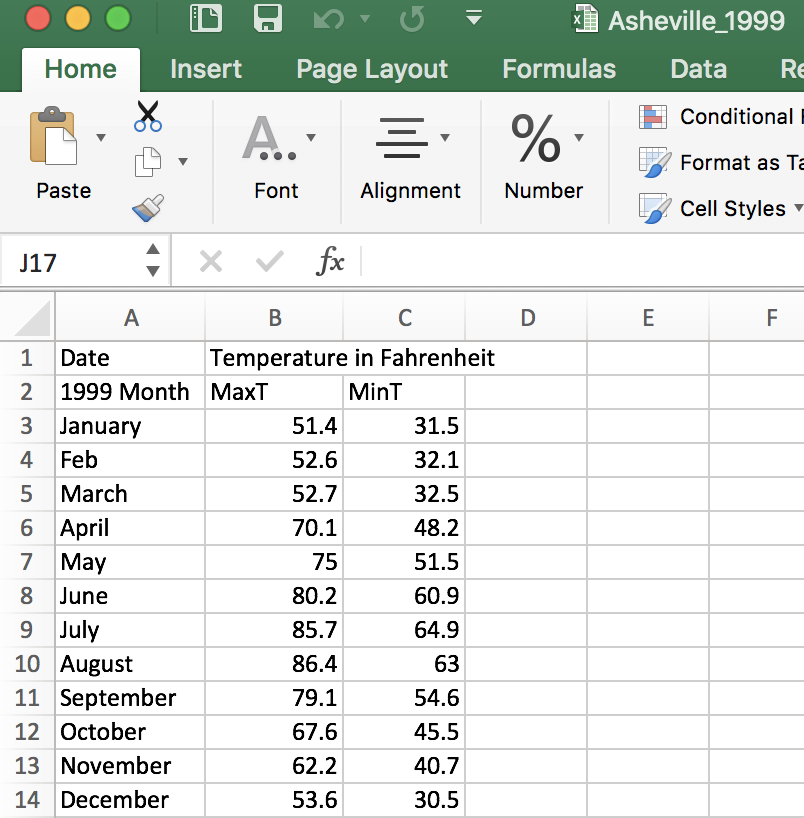
Read the instruction below and Answer the questions by using MATLAB software. Cannot attached the excel file and thus I screen shot the excel file
Read the instruction below and Answer the questions by using MATLAB software. Cannot attached the excel file and thus I screen shot the excel file and post the image below instead of attached the excel file. Please copy the image to the microsoft excel in your computer and answer the questions. Please explain the answers clearly!!! Excel file name: Asheville_1999
Step by Step Solution
There are 3 Steps involved in it
Step: 1

Get Instant Access to Expert-Tailored Solutions
See step-by-step solutions with expert insights and AI powered tools for academic success
Step: 2

Step: 3
Ace Your Homework with AI
Get the answers you need in no time with our AI-driven, step-by-step assistance
Get Started
The Accidental Data Scientist
Authors: Amy Affelt
1st Edition
1573877077, 9781573877077