Answered step by step
Verified Expert Solution
Question
1 Approved Answer
read the lab and solve the lab questions then write a typed lab report following the lab report outlier as a quide. forget last post
read the lab and solve the lab questions then write a typed lab report following the "lab report outlier" as a quide. 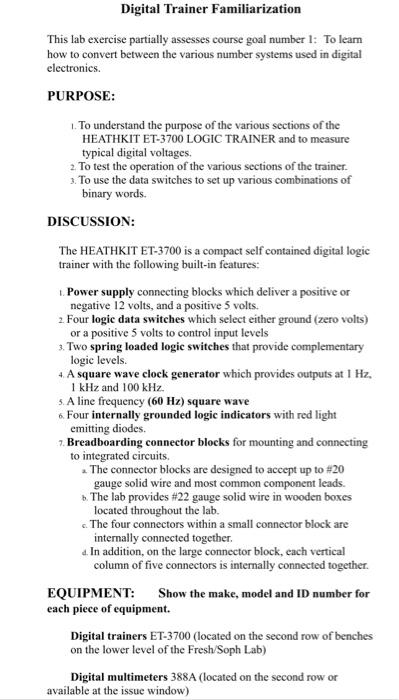

forget last post and just answer lab questions
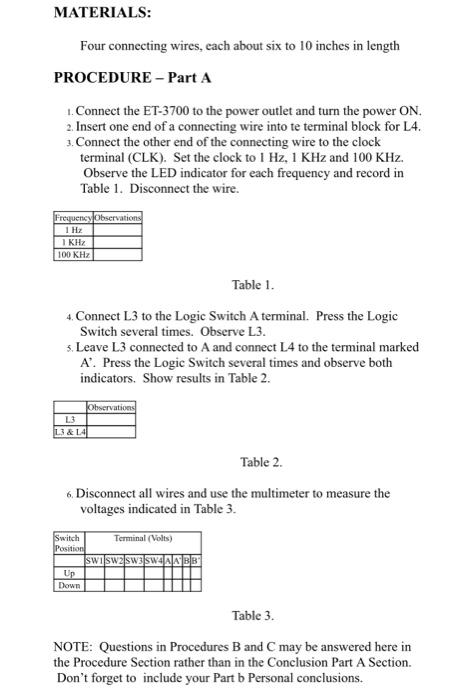
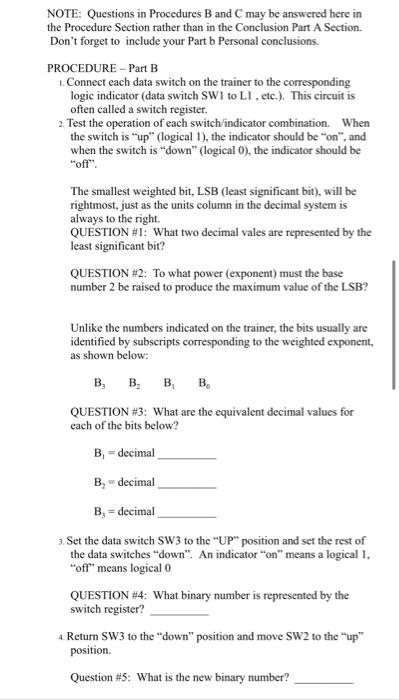
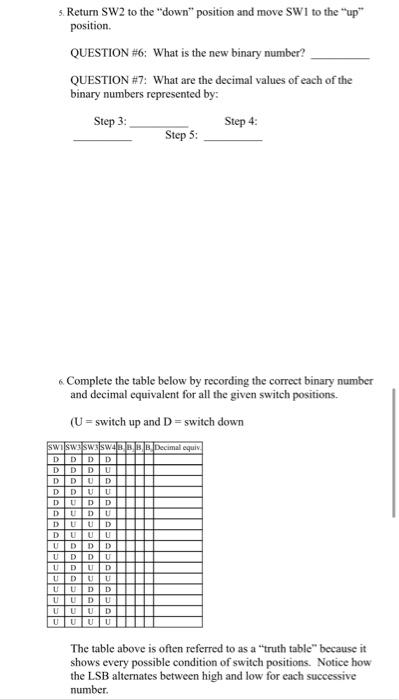
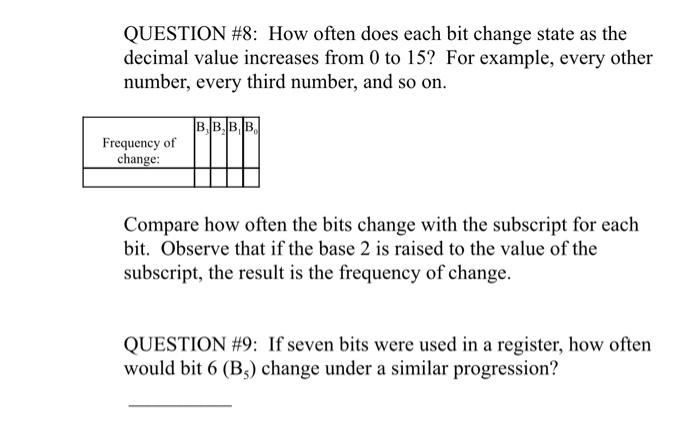
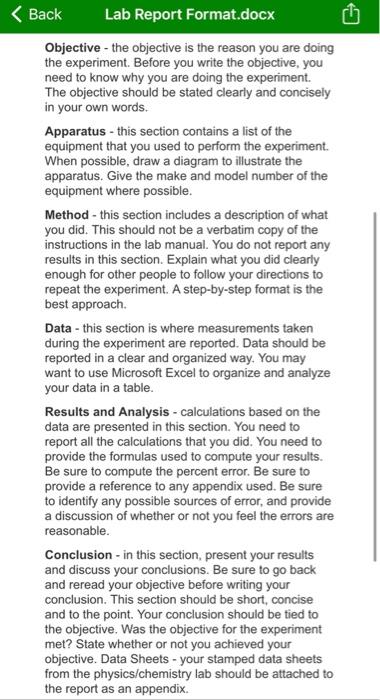
Digital Trainer Familiarization This lab exercise partially assesses course goal number 1: To leam how to convert between the various number systems used in digital electronics. PURPOSE: To understand the purpose of the various sections of the HEATHKIT ET-3700 LOGIC TRAINER and to measure typical digital voltages, 2. To test the operation of the various sections of the trainer. 3. To use the data switches to set up various combinations of binary words. DISCUSSION: The HEATHKIT ET-3700 is a compact self contained digital logic trainer with the following built-in features: Power supply connecting blocks which deliver a positive or negative 12 volts, and a positive 5 volts. 2. Four logic data switches which select either ground (zero volts) or a positive 5 volts to control input levels 3. Two spring loaded logic switches that provide complementary logic levels. 4. A square wave clock generator which provides outputs at 1 Hz. 1 kHz and 100 kHz. 5. A line frequency (60 Hz) square wave 6. Four internally grounded logic indicators with red light emitting diodes. 7. Breadboarding connector blocks for mounting and connecting to integrated circuits. 2. The connector blocks are designed to accept up to #20 gauge solid wire and most common component leads. . The lab provides #22 gauge solid wire in wooden boxes located throughout the lab. c. The four connectors within a small connector block are internally connected together. d. In addition, on the large connector block, each vertical column of five connectors is internally connected together. EQUIPMENT: Show the make, model and ID number for each piece of equipment. Digital trainers ET-3700 (located on the second row of benches on the lower level of the Fresh Soph Lab) Digital multimeters 388A (located on the second row or available at the issue window) MATERIALS: Four connecting wires, each about six to 10 inches in length PROCEDURE - Part A Connect the ET-3700 to the power outlet and turn the power ON. 2. Insert one end of a connecting wire into te terminal block for L4. 3. Connect the other end of the connecting wire to the clock terminal (CLK). Set the clock to 1 Hz, 1 KHz and 100 KHz. Observe the LED indicator for each frequency and record in Table 1. Disconnect the wire. Frequens Observations 1 H 1 KHZ 100 KHz Table 1. 4. Connect L3 to the Logic Switch A terminal. Press the Logic Switch several times. Observe L3. 5. Leave L3 connected to A and connect L4 to the terminal marked A'. Press the Logic Switch several times and observe both indicators. Show results in Table 2. Observations L3 L3 & 14 Table 2. 6 Disconnect all wires and use the multimeter to measure the voltages indicated in Table 3. Switch Terminal (Volts) Position swisw2sw3sW4AABB Up Down Table 3. NOTE: Questions in Procedures B and C may be answered here in the Procedure Section rather than in the Conclusion Part A Section. Don't forget to include your Part b Personal conclusions. NOTE: Questions in Procedures B and C may be answered here in the Procedure Section rather than in the Conclusion Part A Section Don't forget to include your Part b Personal conclusions. PROCEDURE - Part B 1. Connect each data switch on the trainer to the corresponding logic indicator (data switch SW1 to L1, etc.). This circuit is often called a switch register. 2. Test the operation of each switch/indicator combination. When the switch is up" (logical 1), the indicator should be "on", and when the switch is "down" (logical O), the indicator should be "off". The smallest weighted bit, LSB (least significant bit), will be rightmost, just as the units column in the decimal system is always to the right QUESTION #1: What two decimal vales are represented by the least significant bit? QUESTION #2: To what power (exponent) must the base number 2 be raised to produce the maximum value of the LSB? Unlike the numbers indicated on the trainer, the bits usually are identified by subscripts corresponding to the weighted exponent, as shown below: B, B, B, B, QUESTION #3: What are the equivalent decimal values for each of the bits below? B - decimal B-decimal B. = decimal 3. Set the data switch SW3 to the "UP" position and set the rest of the data switches "down". An indicator on" means a logical 1. "off" means logical 0 QUESTION #4: What binary number is represented by the switch register? 4. Return SW3 to the "down" position and move SW2 to the up position Question #5: What is the new binary number? 5. Return SW2 to the "down" position and move SWI to the "up position. QUESTION #6: What is the new binary number? QUESTION #7: What are the decimal values of each of the binary numbers represented by: Step 3: Step 4: Step 5: Complete the table below by recording the correct binary number and decimal equivalent for all the given switch positions. (U=switch up and D=switch down swil swsww.Decimal equiv. DDDD DDDU DDU D DDUU DUD D DUD U DUUD DUU U UD D D UD D U UD U D UD UU UUDD UUDU UU UD UUUU The table above is often referred to as a "truth table" because it shows every possible condition of switch positions. Notice how the LSB alternates between high and low for each successive number QUESTION #8: How often does each bit change state as the decimal value increases from 0 to 15? For example, every other number, every third number, and so on. B.B.B.B. Frequency of change: Compare how often the bits change with the subscript for each bit. Observe that if the base 2 is raised to the value of the subscript, the result is the frequency of change. QUESTION #9: If seven bits were used in a register, how often would bit 6 (B3) change under a similar progression? G Back Lab Report Format.docx Objective - the objective is the reason you are doing the experiment. Before you write the objective, you need to know why you are doing the experiment. The objective should be stated clearly and concisely in your own words. Apparatus - this section contains a list of the equipment that you used to perform the experiment. When possible, draw a diagram to illustrate the apparatus. Give the make and model number of the equipment where possible. Method - this section includes a description of what you did. This should not be a verbatim copy of the instructions in the lab manual. You do not report any results in this section. Explain what you did clearly enough for other people to follow your directions to repeat the experiment. A step-by-step format is the best approach Data - this section is where measurements taken during the experiment are reported. Data should be reported in a clear and organized way. You may want to use Microsoft Excel to organize and analyze your data in a table. Results and Analysis - calculations based on the data are presented in this section. You need to report all the calculations that you did. You need to provide the formulas used to compute your results. Be sure to compute the percent error. Be sure to provide a reference to any appendix used. Be sure to identify any possible sources of error, and provide a discussion of whether or not you feel the errors are reasonable. Conclusion - in this section, present your results and discuss your conclusions. Be sure to go back and reread your objective before writing your conclusion. This section should be short, concise and to the point. Your conclusion should be tied to the objective. Was the objective for the experiment met? State whether or not you achieved your objective. Data Sheets - your stamped data sheets from the physics/chemistry lab should be attached to the report as an appendix. Digital Trainer Familiarization This lab exercise partially assesses course goal number 1: To leam how to convert between the various number systems used in digital electronics. PURPOSE: To understand the purpose of the various sections of the HEATHKIT ET-3700 LOGIC TRAINER and to measure typical digital voltages, 2. To test the operation of the various sections of the trainer. 3. To use the data switches to set up various combinations of binary words. DISCUSSION: The HEATHKIT ET-3700 is a compact self contained digital logic trainer with the following built-in features: Power supply connecting blocks which deliver a positive or negative 12 volts, and a positive 5 volts. 2. Four logic data switches which select either ground (zero volts) or a positive 5 volts to control input levels 3. Two spring loaded logic switches that provide complementary logic levels. 4. A square wave clock generator which provides outputs at 1 Hz. 1 kHz and 100 kHz. 5. A line frequency (60 Hz) square wave 6. Four internally grounded logic indicators with red light emitting diodes. 7. Breadboarding connector blocks for mounting and connecting to integrated circuits. 2. The connector blocks are designed to accept up to #20 gauge solid wire and most common component leads. . The lab provides #22 gauge solid wire in wooden boxes located throughout the lab. c. The four connectors within a small connector block are internally connected together. d. In addition, on the large connector block, each vertical column of five connectors is internally connected together. EQUIPMENT: Show the make, model and ID number for each piece of equipment. Digital trainers ET-3700 (located on the second row of benches on the lower level of the Fresh Soph Lab) Digital multimeters 388A (located on the second row or available at the issue window) MATERIALS: Four connecting wires, each about six to 10 inches in length PROCEDURE - Part A Connect the ET-3700 to the power outlet and turn the power ON. 2. Insert one end of a connecting wire into te terminal block for L4. 3. Connect the other end of the connecting wire to the clock terminal (CLK). Set the clock to 1 Hz, 1 KHz and 100 KHz. Observe the LED indicator for each frequency and record in Table 1. Disconnect the wire. Frequens Observations 1 H 1 KHZ 100 KHz Table 1. 4. Connect L3 to the Logic Switch A terminal. Press the Logic Switch several times. Observe L3. 5. Leave L3 connected to A and connect L4 to the terminal marked A'. Press the Logic Switch several times and observe both indicators. Show results in Table 2. Observations L3 L3 & 14 Table 2. 6 Disconnect all wires and use the multimeter to measure the voltages indicated in Table 3. Switch Terminal (Volts) Position swisw2sw3sW4AABB Up Down Table 3. NOTE: Questions in Procedures B and C may be answered here in the Procedure Section rather than in the Conclusion Part A Section. Don't forget to include your Part b Personal conclusions. NOTE: Questions in Procedures B and C may be answered here in the Procedure Section rather than in the Conclusion Part A Section Don't forget to include your Part b Personal conclusions. PROCEDURE - Part B 1. Connect each data switch on the trainer to the corresponding logic indicator (data switch SW1 to L1, etc.). This circuit is often called a switch register. 2. Test the operation of each switch/indicator combination. When the switch is up" (logical 1), the indicator should be "on", and when the switch is "down" (logical O), the indicator should be "off". The smallest weighted bit, LSB (least significant bit), will be rightmost, just as the units column in the decimal system is always to the right QUESTION #1: What two decimal vales are represented by the least significant bit? QUESTION #2: To what power (exponent) must the base number 2 be raised to produce the maximum value of the LSB? Unlike the numbers indicated on the trainer, the bits usually are identified by subscripts corresponding to the weighted exponent, as shown below: B, B, B, B, QUESTION #3: What are the equivalent decimal values for each of the bits below? B - decimal B-decimal B. = decimal 3. Set the data switch SW3 to the "UP" position and set the rest of the data switches "down". An indicator on" means a logical 1. "off" means logical 0 QUESTION #4: What binary number is represented by the switch register? 4. Return SW3 to the "down" position and move SW2 to the up position Question #5: What is the new binary number? 5. Return SW2 to the "down" position and move SWI to the "up position. QUESTION #6: What is the new binary number? QUESTION #7: What are the decimal values of each of the binary numbers represented by: Step 3: Step 4: Step 5: Complete the table below by recording the correct binary number and decimal equivalent for all the given switch positions. (U=switch up and D=switch down swil swsww.Decimal equiv. DDDD DDDU DDU D DDUU DUD D DUD U DUUD DUU U UD D D UD D U UD U D UD UU UUDD UUDU UU UD UUUU The table above is often referred to as a "truth table" because it shows every possible condition of switch positions. Notice how the LSB alternates between high and low for each successive number QUESTION #8: How often does each bit change state as the decimal value increases from 0 to 15? For example, every other number, every third number, and so on. B.B.B.B. Frequency of change: Compare how often the bits change with the subscript for each bit. Observe that if the base 2 is raised to the value of the subscript, the result is the frequency of change. QUESTION #9: If seven bits were used in a register, how often would bit 6 (B3) change under a similar progression? G Back Lab Report Format.docx Objective - the objective is the reason you are doing the experiment. Before you write the objective, you need to know why you are doing the experiment. The objective should be stated clearly and concisely in your own words. Apparatus - this section contains a list of the equipment that you used to perform the experiment. When possible, draw a diagram to illustrate the apparatus. Give the make and model number of the equipment where possible. Method - this section includes a description of what you did. This should not be a verbatim copy of the instructions in the lab manual. You do not report any results in this section. Explain what you did clearly enough for other people to follow your directions to repeat the experiment. A step-by-step format is the best approach Data - this section is where measurements taken during the experiment are reported. Data should be reported in a clear and organized way. You may want to use Microsoft Excel to organize and analyze your data in a table. Results and Analysis - calculations based on the data are presented in this section. You need to report all the calculations that you did. You need to provide the formulas used to compute your results. Be sure to compute the percent error. Be sure to provide a reference to any appendix used. Be sure to identify any possible sources of error, and provide a discussion of whether or not you feel the errors are reasonable. Conclusion - in this section, present your results and discuss your conclusions. Be sure to go back and reread your objective before writing your conclusion. This section should be short, concise and to the point. Your conclusion should be tied to the objective. Was the objective for the experiment met? State whether or not you achieved your objective. Data Sheets - your stamped data sheets from the physics/chemistry lab should be attached to the report as an appendix Step by Step Solution
There are 3 Steps involved in it
Step: 1

Get Instant Access to Expert-Tailored Solutions
See step-by-step solutions with expert insights and AI powered tools for academic success
Step: 2

Step: 3

Ace Your Homework with AI
Get the answers you need in no time with our AI-driven, step-by-step assistance
Get Started


