

Question: read this report and answer questions provided: ICTE in Transportation and Logistics 2018 (ICTE 2018) Demand forecasting in pharmaceutical supply chains: A case study Galina
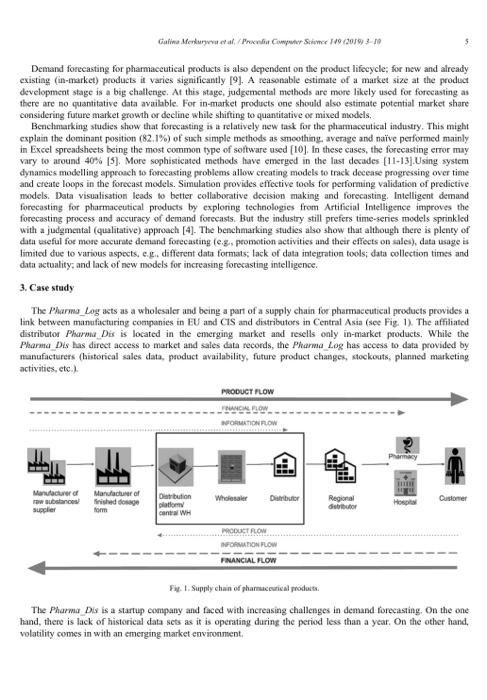
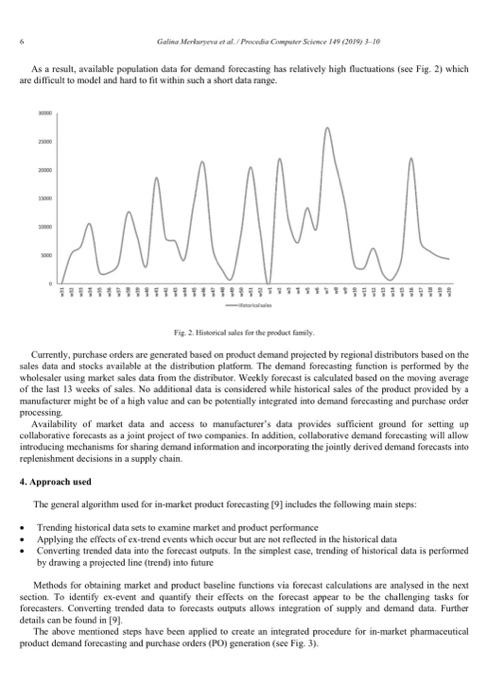
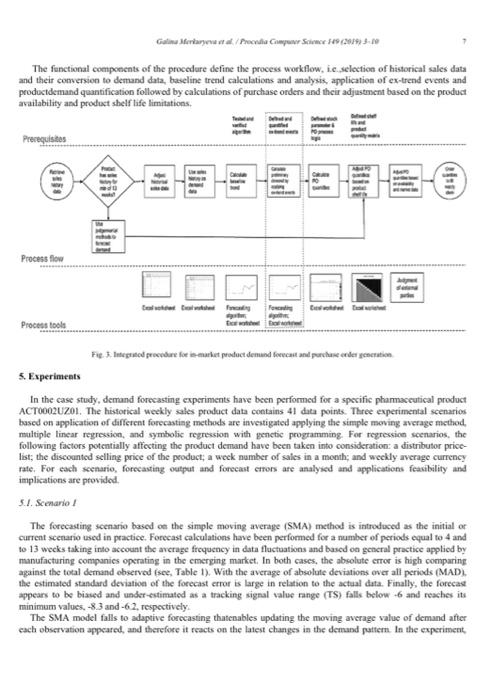
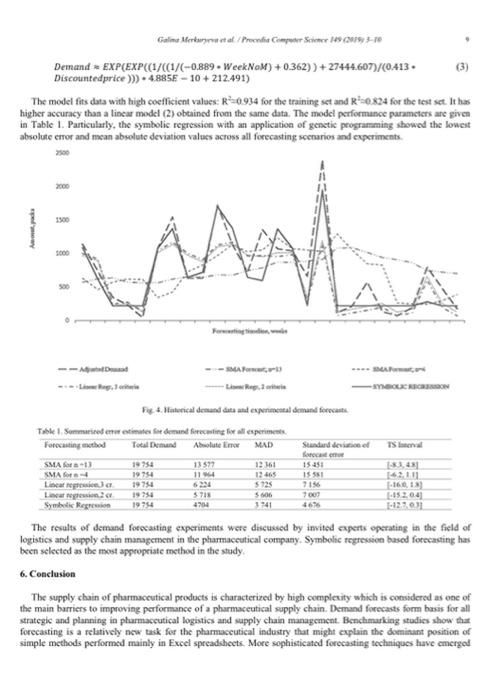
ICTE in Transportation and Logistics 2018 (ICTE 2018) Demand forecasting in pharmaceutical supply chains: A case study Galina Merkuryeva"*, Aija Valberga b, Alexander Smirnov Abstract challenges in demand forecasing for the pharmaccutical indestry are discussod. An infceraficd procodure for in-market product dewand forecasting and parchase odder generation in the plurnaceutical sapoly chain is dencnbed. A ease study for atpply of pharmaceutical products from a wholesaler to a distributive cocrouny located in an emerging onarket is presented. Alterautive forecasting scenarios for thebuseline demand calculations asing the 5M0 model, mulhiple lincar megressions and symbolic rogressoon with gonctic programming are ceperimentally imvetipaked and their practical implicationsane discusaed. Q 2019 The Author. Puhished by Flsevier B.Y. Pcer rciicw under tesponsability of the scicntific committoe of the XCTE in Trampoutation and Logistics 201s (ICTE201s). 1. Introduction Demand forecasting is an integral part of business process management. Despite somplexity and execution of fotecasting processes across different businesses, the intended purpose stays the same: obenining a fairly accurate estimation of future demand for a product or service given historical data and the curment state of the environment (eg., political, social, oconomic) to plan and organixe besinesses accondingly. Forecasting accuracy is still a big challenge in the pharmaccutical indusiry [1]. - Cancopondine author. Td -4371-2642wepa E-mail adders: galline merkupicyairte is 1 Demand forecasts form the basis of all managerial decisions in logistics and supply chain management. Regardless of a push or pull type of a supply chain system, demand forecasting is the starting point for all planning activities and execution processes. Consider push processes that are performed in anticipation of customer nceds sourcing, production, transportation, operating activitics and actions - all require demand forecasts as dota input; the same is true for the pull processes - to plan necessary levels of activity and inventory the customer demand data should be a starting point. Pharmaceutical industry is known as one of the strongest in RAD industries that paid comparatively less attention to development of supply chain technology. High margins gained froms sales of original products allowed the industry to have high supply chain costs [2]. Expiration of patents [2,3] and, as a result, a considerable increase in the number of generic production companies, who focus on the development of efficient, effective and less costly supply chains, require the pharmaceutical industry to turn its attention to challenges in supply future temand forecasting and inventory managemeat, thus confirming the importance of the effectiveness of a supply chain foe the industry further developonent. Moreover, enacring inte emerging makkets requires the expansion of supply chains to be more cost effective compared to ones operating in developed economies as the amount of money spending on medicines in emerging markets is relatively low [3,4]. Didances between distribution centers (mainly, in Europe, and USA) and emergine markets (Uzbekistan, Turkmenistan, Karakhatan, ctc.) put the efficiency of logistics and supply chain oe the top spot. Mix of dernand forceasts with high enror rates and long delivery lead times causes oversupplies and overstocks. If the distance between the market and the point of sales is fived, the demand forecasting error can be decreased by using more efficient and advanced demand forecasting methods. The actuality of the forecasting task has been evidently recognized and valued by top-level management [5]. 2. State-of-the-art The supply chain of pharmaceutical products is charactericed by high conplecity, and stipply atid delivery channels to customers are limited and highly regulated. The complexity is considered as ene of the main barriers to performance and efficiency improvements of a pharmaccutical supply chain [4] There is no room for carof as it might directly affect health of population and nations in a negative way. This is the reason why the costs of a stock outs for pharmaceutical products cannot he expressed anly in monctary terms. Avoiding out-of-stock and forecast accuracy of the customer demand lead to high inventory levels in comparison with the consumer-centric best practices [2]. The most commonly used demand forecast accuracy metrics to assess the quality of forecasts are variations of the following basic metrics: Forecast Bias, Mean Absolute Deviation (MAD). Mean Squared Error (MSE). and Mean Absolute Percentage Error (MAPE) Recommendations on how to seloct an appopriate accuracy metricand how to use it and monitorcould be found in [6]. There are a few more things that should be considered when deciding on how to measure forecast emors or accuracy at each level of a supply chain. In particular, internelations between aceuracy based measures and forecast aggregation levels over the products and forecasting timeline should be taken into account and need to be matched by selected accuracy metrics. In addition, it is well known that forecast errors are dependen on forecasters' location along the chain. This means that forteasts created clooer to ihe dernand point will be more accurate, while forecasts created further up the supply chain will have langer forecast errors. Let's note that for the upstream organizations collaborative forecasts based on sales to the end customer allow to reduce forecas crror [7]. A variety of forecasting methods have been developed bused on two well-known approaches to forecasting: qualitative and quantitative. Correpondingly, qualitative methods such as Executive opinions, Delphi technique. Sales force polling and Custoner services generate forecasts bused on judgements or opinions, while quantitative techniques may be grouped under historical data forecasts, e.g. Naive method, Trend Analysis, Time Series Analysis. Holt's and Winter's models, or under so called aksociative forecasts which ideetify cassal relationships between variables using Simple, Multiple or Symbolic regression. In addition, mixed er combinod modeb enable integration of both approsches. In the pharmaceutical industry, time-series models are used most often (52\%/4) and causal models account for 24%, while judgmental - for 19% and remaining 5% represent mixed or combined models [8]. Demand forecasting for phamaceutical products is also dependent on the product lifecycle; for new and already existiag (in-market) products it varies significantly [9]. A reasonable estimate of a market size at the product development stage is a big challenge. At this stage, judgemental methods are more likely used for forecasting as there are no quantitative data available. For in-market products one should also estimate potential market share considering future market growth or decline while shifting to quantitative or mixed models. Benchmarking studies show that forecasting is a relatively aew task for the pharmaceutical industry. This might explain the dominant position (82.1% ) of such simple methods as smoothing average and naive performed mainly in Excel spreadsheets being the most common type of sottware used [10]. In these cases, the forecasting error may vary to around 40% [5]. More sophisticated methods have emerged in the lust decades [11-13]. Using system dynamics modelling approuch to forecasting problems allow creating models to track decease pogressing over time and create loops in the forecast models. Simulation provides effective tools for performing validation of predictive models. Data visualisstion leads to better collaborative decision making and forecasting. Intelligent demaxd forecasting for pharmaceutical products by exploning technologies from Artificial Intelligence improves the forecasting process and accuracy of demand forecasts. But the industry still prefers time-series models sprinkled with a judgmental (qualitative) approach [4]. The benchmarking studies also show that although there is plenty of data taseful for mose accurate demand forecasting (e.g. peomotion activities and their effects on sales), data usage is limited due to various aspects, e.g.4 different data formats; lack of data intejeration tools; data collection times and data actuality; and lack of new models for increasing forecasting intelligence. 3. Case stady The Pharma_Log acts as a wholesaler and being a part of a supply chain for pharmaceutical products provides a link between manuficturing conpanies in EU and CTS and distributors in Central Asia (see Fig. 1). The afffliated distributor Pharma Dis is located in the emerging market and resells only in-market products. While the Plarma Dis has direct access to market and sales data records, the Pharma Log has aceess to data provided by manufacturers (historical sales data, poduct availability, future product chasges, stockouts, planned marketiag activities, etc.). Fiv. 1. Supply chain of pharnacevrical modost. The Pharma Dis is a startup company and faced with increasing challenges in demand forecasting. On the one hand, thee is lack of historical data sets as it is operating during the period less than a year. On the other hand, volatility comes in with an emerging market environment. As a result, available population data for demand forceasting has relatively high fluctuations (see Fig- 2) which are dificult to modcl and hard to fit within such a short data range. Fit, 2. Hidevical ralei fer the poodsat fatrily. Currently, purchase orders are gencrated based on prodoct densand projected by negional distributors based on the sales data and stocks available at the distribution platform. The demand forecasting function is performed by the wholesaler wing market sales data from the distributor. Weckly forecast is calculated based on the moving average of the last 13 weeks of sales. No additional data is considered while historical sales of the product provided by a manufacturer might be of a high value and can be potentially intcgrated into demand forccasting and purchasc order processing Availability of matket data and access to manufacturer's data provides suffecent ground for setting up collabocative forecasts as a joint project of two companies. In addition, collaborative denand foeccasting will allow introducing mechanisms for shaning demand information and incosporating the jointly derived denand forceasts into replenishment decisions in a supply chain. 4. Approach used The geacral algorithm used for in-market product forecasting [9] inclodes the following main steps: - Trending historical data sets to examine market and product performunce - Applying the effects of ex-trend cvents which occur but are not reflected in the historical data - Convertiag trended data into the forccast outpats. In the simplest case, trending of historical data is performed by drawing a projected line (trend) into futane Methods for obtaining market and poduct baseline functions via forecast calculations are analysed in the next section. To identify ex-event and quantify their effects on the forecast appear to be the challenging tasks for forecasters. Coeveting trended data to forecasts cutputs allows integration of supply and demand daata. Further details can be found in [9]. The above mentioned steps have becn applicd to create an integrated procedure for in-market pharmaceutical product demand forecasting and purchase odders (PO) gencration (sec Fig. 3). The fenctional components of the procedure define the process workflew, i.c.selection of hstorical sales data and their comversion to demand data, baseline trend calculations and analysis, application of ex-trend events and productdemand quantification followod by calculations of purchase orders and their adjustrocnt based on the product arailability and product shelf life limitations. 5. Experimeats In the case study, demand forecasting experiments have been performed for a spocific phamaccutical product ACT0002UZ01. The histotical weekly sales prodact data contains 41 data points. Three experimental scenarios based on application of differcat forccasting methods are investigated applying the simple moving average method. maltiple linear regression, and symbolic regression with genetic programming For regression scenarios, the following factors potentially affecting the product demsand have been taken into consideration: a distribusor pricelist; the discounted selling price of the product; a week number of sales in a monh; and wcekly average currency rate, For each secnario, forecasting outpat and forecast crors are analyied and applications feasibility and implications are provided. 5.1. Scenario I The forecastine secnario based oe the simple moving average (SMA) method is introduced as the initial or current seenario used in practice. Forecast calculations have been performed for a number of periods equal to 4 and to 13 wecks taking into account the avcrage frequency in data fluctuations and bascd on gencral practice applied by manufacturing companies operating in the cmerging market. In both cases, the absolute crror is hagh comparing against the total demand observed (see, Table 1). With the average of absolute deviations ower all periods (MAD). the estimated standard deviatioe of the forecast crror is large in relation to the actal data. Finally, the forecas appears to be bixsed and under-estimaled as a tracking signal value nange (TS) falls below +6 and reaches itu minimum valucs, -8.3 and -6.2 , respectively. The SMA model falls to adaptive forccasting thatenables updating the moving average value of demand after each obscrvation appeared, and therefore it reacts on the laiest changes in the demand putfern. In the experiment, historical demand data are overcomplicated and do not clearly correspond to periodic demand fluctuations. That is why the SMA model generates inconsistent and inaccurate sales forecasts (see, also Fig. 4). 5.2. Scenario 2 In the second series of experiments, the correlation and linear regression andysis have been conductedso determine the causal relationship between product demand and denund influencing factors. Two sequential regression models were constructed. Each model is represented by a linear algehraic equation with more than ene independent variable. All calculations have been performed using MS Exeel butlt-in tools. In iteration 1 , a linear regression model with 3 independent variables such as base price, discounted prise and a weck number of sales for a month (WeckNoM) has been built. In this case, the results for the correlation sbow a strong relationship between product demand and product discounted price, whill WeekNoM variable is taken into consideration just based onthe expert judgment. As a result, the demand regression equation lools as followx: Demand 176600,089+ Baseprice 0,75 Discountedprice +42.824 WeekNoM Because the P value is equal to 0,678 in the ANOVA table, the effect of the base price is not considered as statistically significant and excluded from further consideration. In iteration 2, the demand regression model with two independent variables is described by the followiag linear equation: Demand =158760.752 Discountedprice +43.128 Week.NoM Compared to the SMA model, the absolute crror and mean absolute deviation are more than SUF/ lower in case of regression based forecasts (see Table 1). Forecasting charts calculated based on sequential regression models (I) and (2) are shown in Fig. 4. So, multiple criteria linear regressions show benter results than the SMA model and have better capability to reproduce behavior of the demand pattern. However it still lacks the ability to aceuratcly pretict dentand peak sales. The TS range fall below -6 , and the forecass still are considered as consistently underestimated. Further in depth analysis is needed to explore linear regression-based forecasts and check if noo-linear regression functions (e.g. polynomial, exponcntial, logarithmical) can better fit to the historical dataset. Besides, non-price factors that can influence product demsand such as population size, population ageing, male and female ratio, cte, have to be taken into consideration and systematically examined. 5.3. Scenario 3 In the last series of experiments, the symbolic regression-based forecasting model is built and its performanoe is analysed. Symbolic regression enables to find mathematical expressions in a symbolic form which better fits problem data and predicts a dependent variable from explanalory variables with the smallet error [13-15]. The structure of the model is not predefined, and both the symbolic form of the model and coefficients fir model variables should be determined. Symbolic regression-based forecasting experiments have been performed using the preconfigured tree-based (Kora-style) genetic programming (GP) algorithm for producing symbolic regression models in Hcuristiclab software [13]. The problem data set is the same data set being analysed in the linear regression seenario (iteration 2). The maximum number of generations is experimentally defined equal to 50 generations. A population size is equal to 1000 individuals. Fitness function is evaluated by Pearson R2 coefficient. Available tree nodes are real value constant in a range of [20;20], explanatory variables, arithmetic functions, exponential and logarithmic functions. The maximum tree depth and length are defined by 10 and 25 nodes, respectively. The fint thind of historical sale records is wised to train the model, and the remaining ones to test it In this seenario, 25 GP experiments have been performed, The model with the beit found fitness is expressed in an exponential form: Demand =EXP(EXP((1/((1/(0.889+ WeekNoM )+0.362))+27444.607)/(0.413. Discountedprice )))4.885E10+212.491) The model fits data with high coefficient values: R20934 for the training set and R2=0.824 for the test set. It has higher accuracy than a lincar modcl (2) obeained from the same data. The model performance parameters are given in Table 1. Particulafly, the symbolic regression with an application of gentic programming showed the lowest absolute error and mean abyolute deviation values across all forecasting seenarios and experiments. - i = Liber Bae, 1 aribnie - = Sidkorwerime-13 Hismane 2 arikia nuentionation - imperacencadsacer The rosults of demand foeccaitiag experiments were diseussed by imited cxperts operating in the field of logistics and supply chain managcment in the pharmaceutical compaay. Symbelic rogressce based forecasting hat been selected as the most appropriate method in the study. 6. Conclusion The supply chain of pharmaceutical products is characterired by high complecity which as considered as one of the main burriers to improving performance of a pharmaceutical supply chain. Dernand forecasts form basis for all stratcgic and planning in pluarmaccutical logistics and sapply chain managcment. Benchmarking studics show that forecasting is a felatively ncw task for the pharmaceutical industry that might explain the dominant position of simple methods performcd mainly in Excel spreadshects. More sophisticatcd forecasting technigues have cmergod (10) in sales and demand forecasting applications, e.g, system dynamics modelling approach to track deceasc progressing over time and create loops in the forocast models; simulation to perform validation of prodictive dermand models; data visualisation to suppoet collaborative forecasts and indelligent forecasting to increase forecasting intelligence in supply chain applications. The case study given in the paper is based on the real life example within the pharmaceutical field. The resulis of experimental analysis of three forecasting scenarios show that symbolic regression-based forecasting model providen the best fitting curve to history demand data, lower crror chimates across all seenarios and performed experiments, and the abvility to more accurately ptodict demand peak sales in the study. References [1) Durbha, D. (2016) "State of the Pharmaccukal Supply Chain. Key Talcenwy fiom Lecilharma US 2016" 21" Century Sipply Chain Blog 201si [2] Proaring the Supply Chain Farma Nenke (20|4) -A.T Kearmy Thama Supoly Chain Panel Aold", A.T. Kearbcy, Inc. Avaldble pharma-sedv20152. [Acoraid Apail 30 sols] [3] PWC (3011) "Pharme 2020 Supplyate the Furun, Whikh pues yoo the". Fharmaxvericaly and Life Srietcee. Availabie: [4] Lukas, U. and M. Menosr. "A Cune fer Marmacrukal Swoply Chain Complexity". Fulhece, Onsoorcer", Available: (Accesed Fubnany 31,2018 ] Publishing Co4ttt9 accuracy? [Accktadd November 10. 80111 them". Gowet Rubliahiag Ca. 141 . 261. Scivec: 137+142 Galina Merkurjeva is Professor in the Department of Modelline and Simulation, Faculty of Computer Seicece and Information Techoology al the Riga Techaical University, She holds Dr.sc.ing. from the Institute of Electronics and Compater Science of the Latvian Academy of Sciences (Latvia) and Dr habil. (DSc.) from the Imstitute of Control Sciences of the Russian Acadeny of Sciences (Russia). Her professional interests and experiences are in the fields of discrete-cvent simulation, simulation metamodelling and optimisation, artificial intelligence, logistics and supply chain management. She is the author of moee than 200 publicatioas including 6 books in the field. Contact information: Riga Technical University, 1. Kalku Strect, Riga, LV-1658, L.atvia. Contact her at Galina.Merkurjeva(a rtu.lv. 1. Explain the significance of demand forecasting for supply chain of pharmaceutical products. 2. Explain the role of the Farma_Log company in the supply chain of pharmaceutical products. 3. Which forecasting scenario would you recommend for demand forecasting in the Farma_Log case study? And why
Step by Step Solution
There are 3 Steps involved in it

Get step-by-step solutions from verified subject matter experts