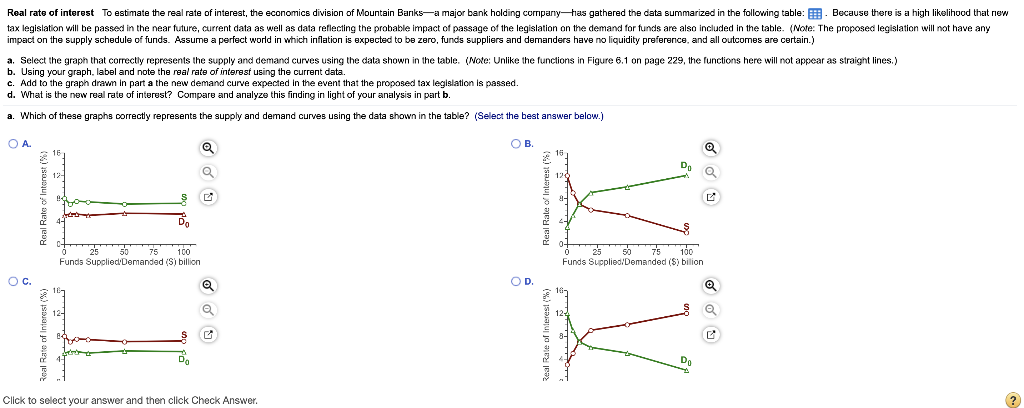
Real rate of interest To estimate the real rate of interest, the economics division of Mountain Banksa major bank holding companyas gathered the data summarized in the following table: B. Because there is a high likelihood that new tax legislation will be passed in the near future, current data as well as data reflecting the probable impact of passage of the legislation on the demand for funds are also included in the table. (Note: The proposed legislation will not have any impact on the supply schedule of funds. Assume a perfect world in which inflation is expected to be zero, funds suppliers and demanders have no liquidity preference, and all outcomes are certain.) a. Select the graph that correctly represents the supply and demand curves using the data shown in the table. (Note:Unlike the functions in Figure 6.1 on page 229, the functions here will not appear as straight lines.) b. Using your graph, label and note the real rate of interest using the current data. c. Add to the graph drawn in part a the new demand curve expected in the event that the proposed tax legislation is passed. d. What is the new real rate of interest? Compare and analyze this finding in light of your analysis in part b. a. Which of these graphs correctly represents the supply and demand curves using the data shown in the table? (Select the best answer below.) . OB 16 Do Q Real Rate of Interesti D 25 100 Funds Supplied Demanded (S) billion 50 75 100 Funds Supplies Demanded (S) bilion AA c. OD. 27 12- Real Rate of Inte Real Rate of Interest (%) Da Click to select your answer and then click Check Answer. ? Real rate of interest To estimate the real rate of interest, the economics division of Mountain Banksa major bank holding companyas gathered the data summarized in the following table: B. Because there is a high likelihood that new tax legislation will be passed in the near future, current data as well as data reflecting the probable impact of passage of the legislation on the demand for funds are also included in the table. (Note: The proposed legislation will not have any impact on the supply schedule of funds. Assume a perfect world in which inflation is expected to be zero, funds suppliers and demanders have no liquidity preference, and all outcomes are certain.) a. Select the graph that correctly represents the supply and demand curves using the data shown in the table. (Note:Unlike the functions in Figure 6.1 on page 229, the functions here will not appear as straight lines.) b. Using your graph, label and note the real rate of interest using the current data. c. Add to the graph drawn in part a the new demand curve expected in the event that the proposed tax legislation is passed. d. What is the new real rate of interest? Compare and analyze this finding in light of your analysis in part b. a. Which of these graphs correctly represents the supply and demand curves using the data shown in the table? (Select the best answer below.) . OB 16 Do Q Real Rate of Interesti D 25 100 Funds Supplied Demanded (S) billion 50 75 100 Funds Supplies Demanded (S) bilion AA c. OD. 27 12- Real Rate of Inte Real Rate of Interest (%) Da Click to select your answer and then click Check