

Answered step by step
Verified Expert Solution
Question
1 Approved Answer
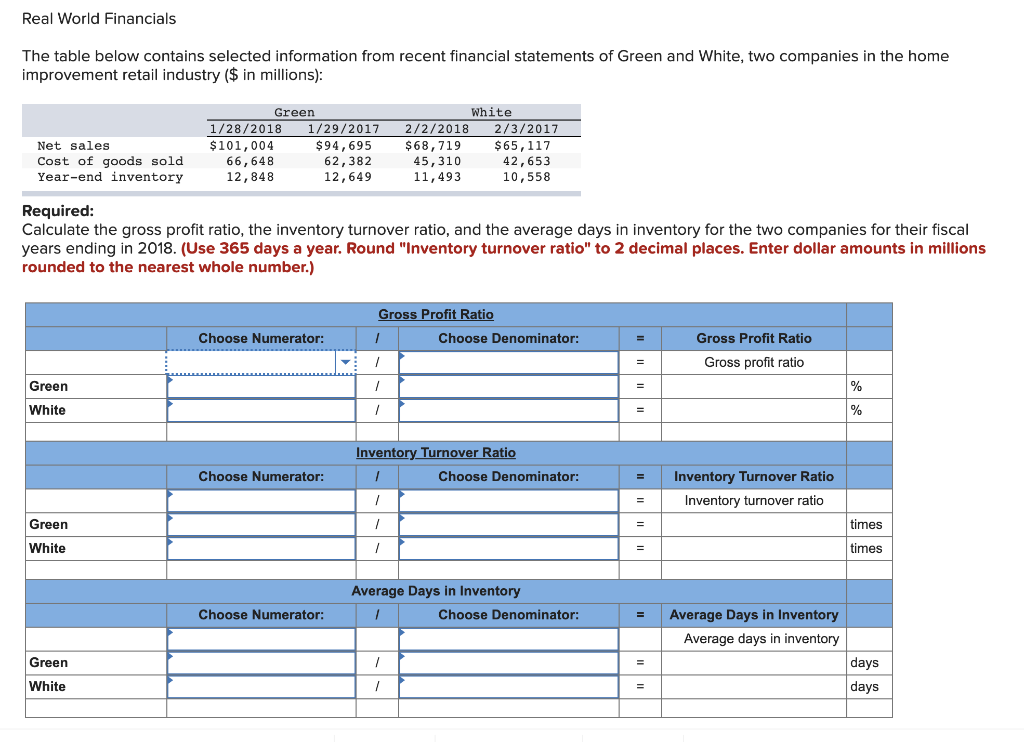
Real World Financials The table below contains selected information from recent financial statements of Green and White, two companies in the home improvement retail industry
Step by Step Solution
There are 3 Steps involved in it
Step: 1

Get Instant Access to Expert-Tailored Solutions
See step-by-step solutions with expert insights and AI powered tools for academic success
Step: 2

Step: 3
Ace Your Homework with AI
Get the answers you need in no time with our AI-driven, step-by-step assistance
Get Started
Between The Lines Of The Balance Sheet The Plain Mans Guide To Published Accounts
Authors: Michael Greener
2nd Edition
0080240712, 9780080240718