Answered step by step
Verified Expert Solution
Question
1 Approved Answer
Really hard excel quesiton... I love you if u can help in any way thanks . For this assignment, please use excel file group _assignment


Really hard excel quesiton... I love you if u can help in any way thanks .
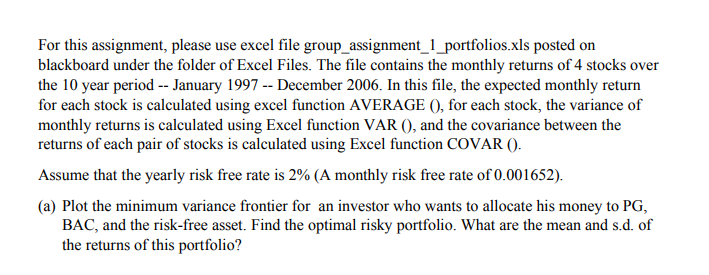
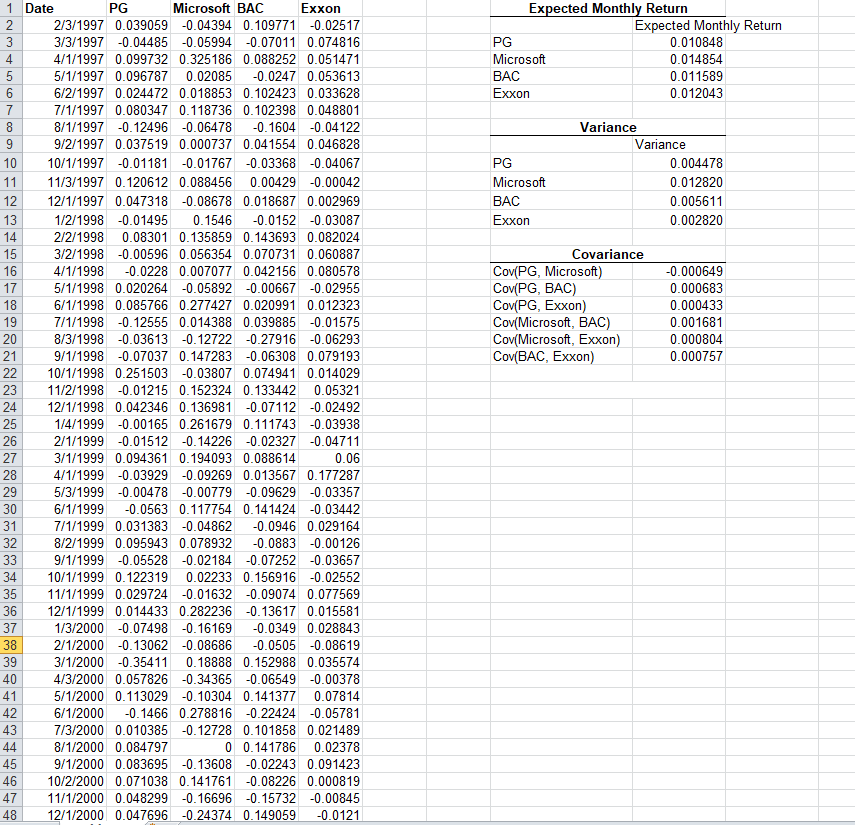
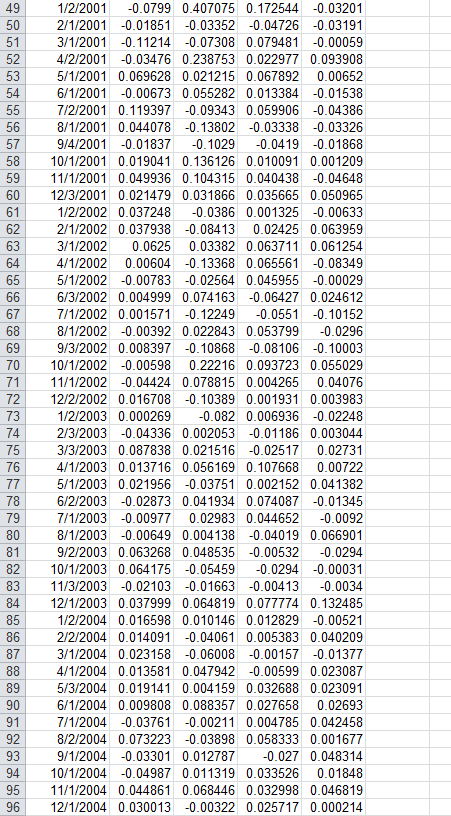
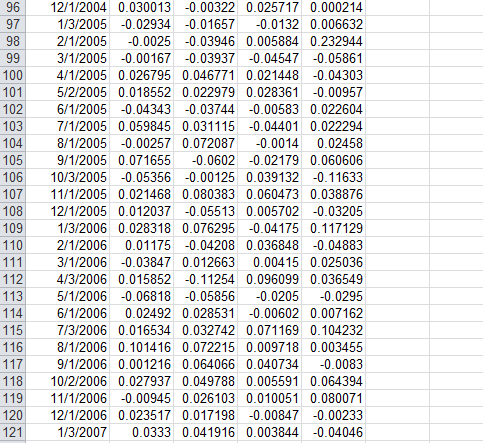
For this assignment, please use excel file group _assignment 1 portfolios.xls posted on blackboard under the folder of Excel Files. The file contains the monthly returns of 4 stocks over the 10 year period -- January 1997 - December 2006. In this file, the expected monthly return for each stock is calculated using excel function AVERAGE O, for each stock, the variance of monthly returns is calculated using Excel function VAR 0, and the covariance between the returns of each pair of stocks is calculated using Excel function COVAR O Assume that the yearly risk free rate is 2% (A monthly risk free rate of 0.001652) (a) Plot the minimum variance frontier for an investor who wants to allocate his money to PG, BAC, and the risk-free asset. Find the optimal risky portfolio. What are the mean and s.d. of the returns of this portfolio? 1 Date PG Microsoft BAC Exxon Expected Monthly Return 2/3/1997 0.039059 0.04394 0.109771 -0.02517 3/3/1997-0.04485 0.05994 -0.07011 0.074816 4/1/1997 0.099732 0.325186 0.088252 0.051471 5/1/1997 0.096787 0.02085-0.0247 0.053613 6/2/1997 0.024472 0.018853 0.102423 0.033628 7/1/1997 0.080347 0.118736 0.1023980.048801 8/1/1997 -0.12496-0.06478 -0.1604 0.04122 9/2/1997 0.037519 0.000737 0.041554 0.046828 10 10/1/19970.01181-0.01767 -0.03368 0.04067 11 11/3/19970.120612 0.088456 0.00429 0.00042 12 121/1997 0.047318 -0.08678 0.018687 0.002969 1/2/1998 0.01495 0.1546 0.0152 0.03087 2/2/1998 0.08301 0.135859 0.143693 0.082024 3/2/1998 -0.00596 0.056354 0.070731 0.060887 4/1/19980.0228 0.007077 0.042156 0.080578 5/1/1998 0.020264 -0.05892 -0.00667 -0.02955 6/1/1998 0.085766 0.277427 0.020991 0.012323 7/1/1998-0.12555 0.014388 0.039885 -0.01575 8/3/1998 -0.03613 0.12722 -0.27916 -0.06293 9/1/1998-0.07037 0.147283 0.06308 0.079193 10/1/1998 0.251503 -0.038070.074941 0.014029 23 11/2/1998 -0.01215 0.152324 0.133442 0.05321 24 12/1/1998 0.042346 0.136981-0.07112 -0.02492 1/4/1999 -0.00165 0.261679 0.111743 -0.03938 2/1/1999 -0.01512 0.14226 0.02327 -0.04711 0.06 4/1/1999 -0.03929 -0.09269 0.013567 0.177287 5/3/1999 -0.00478 -0.00779 -0.09629 -0.03357 6/1/1999-0.0563 0.117754 0.141424 0.03442 7/1/1999 0.031383 -0.048620.0946 0.029164 8/2/1999 0.095943 0.078932 -0.0883 -0.00126 9/1/1999 -0.05528 0.02184 0.07252 -0.03657 34 10/1/1999 0.122319 0.02233 0.156916-0.02552 11/1/1999 0.029724 -0.01632-0.09074 0.077569 36 12/1/1999 0.014433 0.2822360.13617 0.015581 1/3/2000 0.07498 0.16169 0.0349 0.028843 2/1/2000 0.13062 0.08686 0.0505 -0.08619 3/1/2000 -0.354110.18888 0.152988 0.035574 4/3/2000 0.057826-0.34365 -0.06549 -0.00378 5/1/2000 0.113029 -0.10304 0.141377 0.07814 6/1/2000 0.1466 0.278816 0.22424 -0.05781 7/3/2000 0.010385 0.12728 0.101858 0.021489 0 0.141786 0.02378 9/1/2000 0.083695 -0.13608 0.02243 0.091423 46 10/2/2000 0.071038 0.141761-0.08226 0.000819 47 11/1/2000 0.048299 -0.166960.15732 -0.00845 48 12/1/2000 0.047696 -0.24374 0.149059 -0.0121 Expected Monthly Return 0.010848 0.014854 0.011589 0.012043 Microsoft Exxon Variance Variance 0.004478 0.012820 0.005611 0.002820 Microsoft Exxon Covariance Cov(PG, Microsoft) Cov(PG, BAC) Cov(PG, Exxon) Cov(Microsoft, BAC) Cov(Microsoft, Exxon) Cov(BAC, Exxon) -0.000649 0.000683 0.000433 0.001681 0.000804 0.000757 20 21 25 26 27 28 29 30 31 32 3/1/1999 0.094361 0.194093 0.088614 35 37 38 39 40 42 8/1/2000 0.084797 1/2/2001 0.0799 0.407075 0.172544 -0.03201 2/1/2001-0.01851 0.03352 0.04726 -0.03191 3/1/2001-0.11214 0.07308 0.079481-0.00059 4/2/2001-0.03476 0.238753 0022977| 0.093908 5/1/2001 0.069628 0.021215 0.067892 0.00652 6/1/2001-0.00673 0.055282 0.013384 -0.01538 7/2/20010.119397-0.09343 0.059906 0.04386 52 8/1/2001 0.044078 0.13802 -0.03338 0.0332 9/4/2001-0.01837 -0.1029 -0.0419 -0.01868 10/1/2001 0.019041 0.136126 0.010091 0.001209 59 11/1/20010.049936 0.104315 0.040438 0.04648 60 12/3/2001 0.021479 0.031866 0.035665 0.050965 1/2/2002 0.037248 0.0386 0.001325 -0.00633 2/1/2002 0.037938 0.084130.02425 0.063959 3/1/2002 0.0625 0.03382 0.063711 0.061254 4/1/2002 0.00604 0.13368 0.065561 -0.08349 5/1/2002 -0.00783 -0.02564 0.045955 -0.00029 6/3/2002 0.004999 0.074163 0.06427 0.024612 7/1/2002 0.0015710.12249 -0.0551 -0.10152 8/1/2002 -0.00392 0.022843 0.053799 0.0296 9/3/2002 0.008397 0.10868 0.08106 -0.10003 10/1/2002 0.00598 0.22216 0.093723 0.055029 71 11/1/2002 -0.04424 0.078815 0.004265 0.04076 72 12/2/2002 0.016708 0.10389 0.001931 0.003983 1/2/2003 0.000269 0.082 0.006936-0.02248 74 2/3/2003 0.04336 0.002053 0.01186 0.003044 3/3/2003 0.087838 0.021516 -0.02517 0.02731 4/1/2003 0.013716 0.056169 0.107668 0.00722 5/1/2003 0.021956-0.03751 0.002152 0.041382 6/2/2003 -0.02873 0.041934 0.074087 -0.01345 7/1/20030.00977 0.02983 0.044652 -0.0092 8/1/20030.00649 0.004138 -0.04019 0.066901 9/2/2003 0.063268 0.048535 0.00532 0.0294 82 10/1/2003 0.064175 0.054590.0294 -0.00031 83 11/3/20030.02103 0.01663 -0.004130.0034 12/1/2003 0.037999 0.064819 0.077774 0.132485 1/2/2004 0.016598 0.010146 0.012829 -0.00521 86 2/2/2004 0.014091-0.04061 0.005383 0.040209 3/1/2004 0.023158 0.06008 -0.00157 -0.01377 4/1/2004 0.013581 0.047942 -0.00599 0.023087 5/3/2004 0.019141 0.004159 0.032688 0.023091 6/1/2004 0.009808 0.088357 0.027658 0.02693 7/1/2004-0.03761 0.00211 0.004785 0.042458 8/2/2004 0.073223 0.03898 0.058333 0.001677 9/1/2004-0.03301 0.012787 0.027 0.048314 94 10/1/2004 -0.04987 0.011319 0.033526 0.01848 11/1/2004 0.044861 0.068446 0.032998 0.046819 96 12/1/2004 0.030013 -0.00322 0.025717 0.000214 84 87 96 12/1/2004 0.0300130.00322 0.025717 0.000214 1/3/2005-0.02934 0.01657 -0.0132 0.006632 2/1/2005 -0.0025 -0.03946 0.005884 0.232944 99 3/1/2005 -0.00167 0.03937 -0.04547 -0.05861 100 4/1/2005 0.026795 0.046771 0.021448 0.04303 5/2/2005 0.018552 0.022979 0.028361 0.00957 102 6/1/20050.04343 -0.03744 -0.00583 0.022604 103 7/1/2005 0.059845 0.031115 0.04401 0.022294 1048/1/2005 -0.00257 0.072087 -0.00140.02458 105 9/1/2005 0.071655 -0.0602 -0.02179 0.060606 106 10/3/20050.05356 -0.00125 0.039132 -0.11633 107 11/1/2005 0.021468 0.080383 0.060473 0.038876 108 12/1/2005 0.012037 0.05513 0.005702-0.03205 1/3/2006 0.028318 0.076295 -0.04175 0.117129 110 2/1/2006 0.01175 -0.04208 0.036848 -0.04883 111 3/1/20060.03847 0.012663 0.00415 0.025036 112 4/3/2006 0.015852 -0.11254 0.096099 0.036549 113 5/1/2006 0.06818 -0.05856 0.0205 0.0295 1146/1/2006 0.02492 0.028531 0.00602 0.007162 1157/3/2006 0.016534 0.032742 0.071169 0.104232 116 8/1/2006 0.101416 0.072215 0.009718 0.003455 117 9/1/2006 0.001216 0.064066 0.40340.0083 118 10/2/2006 0.027937 0.049788 0.005591 0.064394 119 11/1/20060.00945 0.026103 0.010051 0.080071 120 12/1/2006 0.023517 0.017198 0.00847 -0.00233 121 1/3/2007 0.0333 0.041916 0.003844 -0.04046 101 109 For this assignment, please use excel file group _assignment 1 portfolios.xls posted on blackboard under the folder of Excel Files. The file contains the monthly returns of 4 stocks over the 10 year period -- January 1997 - December 2006. In this file, the expected monthly return for each stock is calculated using excel function AVERAGE O, for each stock, the variance of monthly returns is calculated using Excel function VAR 0, and the covariance between the returns of each pair of stocks is calculated using Excel function COVAR O Assume that the yearly risk free rate is 2% (A monthly risk free rate of 0.001652) (a) Plot the minimum variance frontier for an investor who wants to allocate his money to PG, BAC, and the risk-free asset. Find the optimal risky portfolio. What are the mean and s.d. of the returns of this portfolio? 1 Date PG Microsoft BAC Exxon Expected Monthly Return 2/3/1997 0.039059 0.04394 0.109771 -0.02517 3/3/1997-0.04485 0.05994 -0.07011 0.074816 4/1/1997 0.099732 0.325186 0.088252 0.051471 5/1/1997 0.096787 0.02085-0.0247 0.053613 6/2/1997 0.024472 0.018853 0.102423 0.033628 7/1/1997 0.080347 0.118736 0.1023980.048801 8/1/1997 -0.12496-0.06478 -0.1604 0.04122 9/2/1997 0.037519 0.000737 0.041554 0.046828 10 10/1/19970.01181-0.01767 -0.03368 0.04067 11 11/3/19970.120612 0.088456 0.00429 0.00042 12 121/1997 0.047318 -0.08678 0.018687 0.002969 1/2/1998 0.01495 0.1546 0.0152 0.03087 2/2/1998 0.08301 0.135859 0.143693 0.082024 3/2/1998 -0.00596 0.056354 0.070731 0.060887 4/1/19980.0228 0.007077 0.042156 0.080578 5/1/1998 0.020264 -0.05892 -0.00667 -0.02955 6/1/1998 0.085766 0.277427 0.020991 0.012323 7/1/1998-0.12555 0.014388 0.039885 -0.01575 8/3/1998 -0.03613 0.12722 -0.27916 -0.06293 9/1/1998-0.07037 0.147283 0.06308 0.079193 10/1/1998 0.251503 -0.038070.074941 0.014029 23 11/2/1998 -0.01215 0.152324 0.133442 0.05321 24 12/1/1998 0.042346 0.136981-0.07112 -0.02492 1/4/1999 -0.00165 0.261679 0.111743 -0.03938 2/1/1999 -0.01512 0.14226 0.02327 -0.04711 0.06 4/1/1999 -0.03929 -0.09269 0.013567 0.177287 5/3/1999 -0.00478 -0.00779 -0.09629 -0.03357 6/1/1999-0.0563 0.117754 0.141424 0.03442 7/1/1999 0.031383 -0.048620.0946 0.029164 8/2/1999 0.095943 0.078932 -0.0883 -0.00126 9/1/1999 -0.05528 0.02184 0.07252 -0.03657 34 10/1/1999 0.122319 0.02233 0.156916-0.02552 11/1/1999 0.029724 -0.01632-0.09074 0.077569 36 12/1/1999 0.014433 0.2822360.13617 0.015581 1/3/2000 0.07498 0.16169 0.0349 0.028843 2/1/2000 0.13062 0.08686 0.0505 -0.08619 3/1/2000 -0.354110.18888 0.152988 0.035574 4/3/2000 0.057826-0.34365 -0.06549 -0.00378 5/1/2000 0.113029 -0.10304 0.141377 0.07814 6/1/2000 0.1466 0.278816 0.22424 -0.05781 7/3/2000 0.010385 0.12728 0.101858 0.021489 0 0.141786 0.02378 9/1/2000 0.083695 -0.13608 0.02243 0.091423 46 10/2/2000 0.071038 0.141761-0.08226 0.000819 47 11/1/2000 0.048299 -0.166960.15732 -0.00845 48 12/1/2000 0.047696 -0.24374 0.149059 -0.0121 Expected Monthly Return 0.010848 0.014854 0.011589 0.012043 Microsoft Exxon Variance Variance 0.004478 0.012820 0.005611 0.002820 Microsoft Exxon Covariance Cov(PG, Microsoft) Cov(PG, BAC) Cov(PG, Exxon) Cov(Microsoft, BAC) Cov(Microsoft, Exxon) Cov(BAC, Exxon) -0.000649 0.000683 0.000433 0.001681 0.000804 0.000757 20 21 25 26 27 28 29 30 31 32 3/1/1999 0.094361 0.194093 0.088614 35 37 38 39 40 42 8/1/2000 0.084797 1/2/2001 0.0799 0.407075 0.172544 -0.03201 2/1/2001-0.01851 0.03352 0.04726 -0.03191 3/1/2001-0.11214 0.07308 0.079481-0.00059 4/2/2001-0.03476 0.238753 0022977| 0.093908 5/1/2001 0.069628 0.021215 0.067892 0.00652 6/1/2001-0.00673 0.055282 0.013384 -0.01538 7/2/20010.119397-0.09343 0.059906 0.04386 52 8/1/2001 0.044078 0.13802 -0.03338 0.0332 9/4/2001-0.01837 -0.1029 -0.0419 -0.01868 10/1/2001 0.019041 0.136126 0.010091 0.001209 59 11/1/20010.049936 0.104315 0.040438 0.04648 60 12/3/2001 0.021479 0.031866 0.035665 0.050965 1/2/2002 0.037248 0.0386 0.001325 -0.00633 2/1/2002 0.037938 0.084130.02425 0.063959 3/1/2002 0.0625 0.03382 0.063711 0.061254 4/1/2002 0.00604 0.13368 0.065561 -0.08349 5/1/2002 -0.00783 -0.02564 0.045955 -0.00029 6/3/2002 0.004999 0.074163 0.06427 0.024612 7/1/2002 0.0015710.12249 -0.0551 -0.10152 8/1/2002 -0.00392 0.022843 0.053799 0.0296 9/3/2002 0.008397 0.10868 0.08106 -0.10003 10/1/2002 0.00598 0.22216 0.093723 0.055029 71 11/1/2002 -0.04424 0.078815 0.004265 0.04076 72 12/2/2002 0.016708 0.10389 0.001931 0.003983 1/2/2003 0.000269 0.082 0.006936-0.02248 74 2/3/2003 0.04336 0.002053 0.01186 0.003044 3/3/2003 0.087838 0.021516 -0.02517 0.02731 4/1/2003 0.013716 0.056169 0.107668 0.00722 5/1/2003 0.021956-0.03751 0.002152 0.041382 6/2/2003 -0.02873 0.041934 0.074087 -0.01345 7/1/20030.00977 0.02983 0.044652 -0.0092 8/1/20030.00649 0.004138 -0.04019 0.066901 9/2/2003 0.063268 0.048535 0.00532 0.0294 82 10/1/2003 0.064175 0.054590.0294 -0.00031 83 11/3/20030.02103 0.01663 -0.004130.0034 12/1/2003 0.037999 0.064819 0.077774 0.132485 1/2/2004 0.016598 0.010146 0.012829 -0.00521 86 2/2/2004 0.014091-0.04061 0.005383 0.040209 3/1/2004 0.023158 0.06008 -0.00157 -0.01377 4/1/2004 0.013581 0.047942 -0.00599 0.023087 5/3/2004 0.019141 0.004159 0.032688 0.023091 6/1/2004 0.009808 0.088357 0.027658 0.02693 7/1/2004-0.03761 0.00211 0.004785 0.042458 8/2/2004 0.073223 0.03898 0.058333 0.001677 9/1/2004-0.03301 0.012787 0.027 0.048314 94 10/1/2004 -0.04987 0.011319 0.033526 0.01848 11/1/2004 0.044861 0.068446 0.032998 0.046819 96 12/1/2004 0.030013 -0.00322 0.025717 0.000214 84 87 96 12/1/2004 0.0300130.00322 0.025717 0.000214 1/3/2005-0.02934 0.01657 -0.0132 0.006632 2/1/2005 -0.0025 -0.03946 0.005884 0.232944 99 3/1/2005 -0.00167 0.03937 -0.04547 -0.05861 100 4/1/2005 0.026795 0.046771 0.021448 0.04303 5/2/2005 0.018552 0.022979 0.028361 0.00957 102 6/1/20050.04343 -0.03744 -0.00583 0.022604 103 7/1/2005 0.059845 0.031115 0.04401 0.022294 1048/1/2005 -0.00257 0.072087 -0.00140.02458 105 9/1/2005 0.071655 -0.0602 -0.02179 0.060606 106 10/3/20050.05356 -0.00125 0.039132 -0.11633 107 11/1/2005 0.021468 0.080383 0.060473 0.038876 108 12/1/2005 0.012037 0.05513 0.005702-0.03205 1/3/2006 0.028318 0.076295 -0.04175 0.117129 110 2/1/2006 0.01175 -0.04208 0.036848 -0.04883 111 3/1/20060.03847 0.012663 0.00415 0.025036 112 4/3/2006 0.015852 -0.11254 0.096099 0.036549 113 5/1/2006 0.06818 -0.05856 0.0205 0.0295 1146/1/2006 0.02492 0.028531 0.00602 0.007162 1157/3/2006 0.016534 0.032742 0.071169 0.104232 116 8/1/2006 0.101416 0.072215 0.009718 0.003455 117 9/1/2006 0.001216 0.064066 0.40340.0083 118 10/2/2006 0.027937 0.049788 0.005591 0.064394 119 11/1/20060.00945 0.026103 0.010051 0.080071 120 12/1/2006 0.023517 0.017198 0.00847 -0.00233 121 1/3/2007 0.0333 0.041916 0.003844 -0.04046 101 109
Step by Step Solution
There are 3 Steps involved in it
Step: 1

Get Instant Access to Expert-Tailored Solutions
See step-by-step solutions with expert insights and AI powered tools for academic success
Step: 2

Step: 3

Ace Your Homework with AI
Get the answers you need in no time with our AI-driven, step-by-step assistance
Get Started


