

Question: Really need help on these questions, please show work Problem set 2: use the following information to answer questions 4-7 (5 points total): We continue


Really need help on these questions, please show work
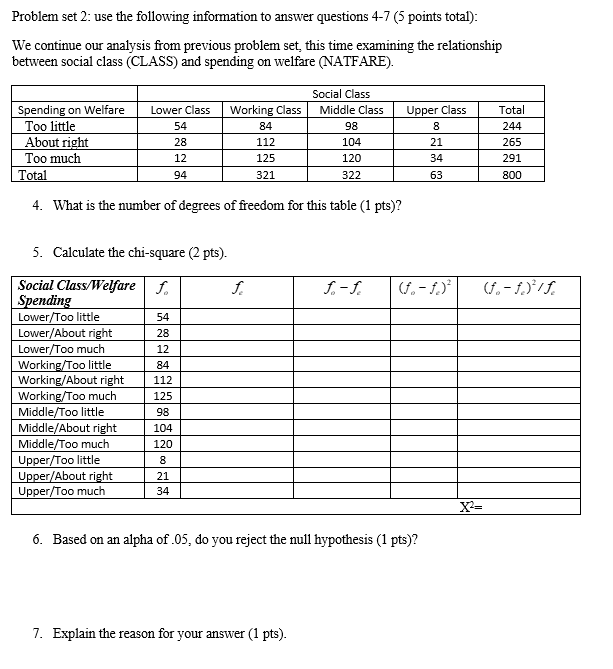
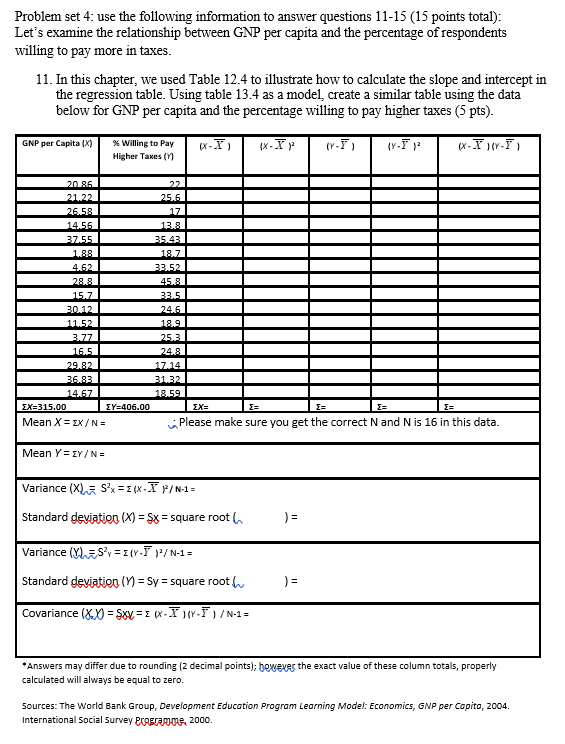
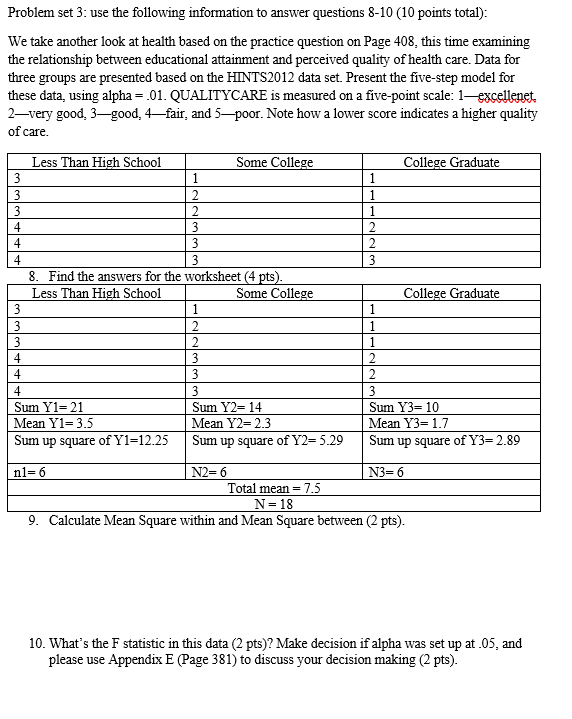
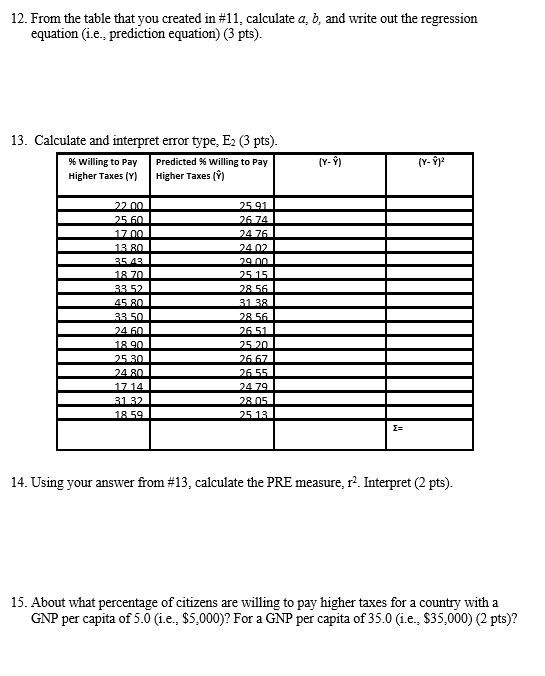
Problem set 2: use the following information to answer questions 4-7 (5 points total): We continue our analysis from previous problem set, this time examining the relationship between social class (CLASS) and spending on welfare (NATFARE). Social Class Spending on Welfare Lower Class Working Class Middle Class Upper Class Total Too little 54 34 8 244 About right 28 112 104 21 265 Too much 12 125 120 34 291 Total 94 321 322 63 800 4. What is the number of degrees of freedom for this table (1 pts)? 5. Calculate the chi-square (2 pts). Social Class/ Welfare f. - f. ( f . - f. ) Spending Lower/Too little 54 Lower/About right 28 Lower/ Too much 12 Working/Too little Working/About right 112 Working/Too much 125 Middle/Too little 98 Middle/About right 104 Middle/Too much 120 Upper/Too little 8 Upper/About right 21 Upper/Too much 34 X'= 6. Based on an alpha of .05, do you reject the null hypothesis (1 pts)? 7. Explain the reason for your answer (1 pts).Problem set 4: use the following information to answer questions 11-15 (15 points total): Let's examine the relationship between GNP per capita and the percentage of respondents willing to pay more in taxes. 11. In this chapter, we used Table 12.4 to illustrate how to calculate the slope and intercept in the regression table. Using table 13.4 as a model, create a similar table using the data below for GNP per capita and the percentage willing to pay higher taxes (5 pts). GNP per Capita (X) % Willing to Pay ( x - X ) ( Y - F ) ( x - X ) ( Y - F ) Higher Taxes (7] 20 86 21.22 25.6 26.58 17 14.56 13.8 37.55 15.43 1.88 18.7 4.62 33.52 28.8 15.8 15.7 33.5 30.12 24.6 11.52 18.9 3.77 25.3 16.5 24.8 29.82 17.14 36.83 31.32 14.67 18.59 EX=315.00 EY=406.00 IX= I= I= I= Mean X = EX / N = Please make sure you get the correct N and N is 16 in this data. Mean Y = EY / N = Variance (X) = Sx = =(X-X p/N-1= Standard deviation (X) = $8 = square root ( Variance (YES = [(Y-Y )/ N-1= Standard deviation (V) = Sy = square root Covariance (XX) = Sw = = (x-X j(Y-F) / N-1 = 'Answers may differ due to rounding (2 decimal points); however the exact value of these column totals, properly calculated will always be equal to zero. Sources: The World Bank Group, Development Education Program Learning Model: Economics, GNP per Capita, 2004. International Social Survey Progragigs, 2000.Problem set 3: use the following information to answer questions 8-10 (10 points total): We take another look at health based on the practice question on Page 408, this time examining the relationship between educational attainment and perceived quality of health care. Data for three groups are presented based on the HINTS2012 data set. Present the five-step model for these data, using alpha = .01. QUALITYCARE is measured on a five-point scale: 1-excellent, 2-very good, 3-good, 4-fair, and 5-poor. Note how a lower score indicates a higher quality of care. Less Than High School Some College College Graduate 3 1 1 3 2 1 3 2 1 4 3 2 3 2 3 3 8. Find the answers for the worksheet (4 pts) Less Than High School Some College College Graduate 3 1 1 3 1 3 2 1 3 2 3 2 4 3 Sum Y1=21 Sum Y2= 14 Sum Y3= 10 Mean Y1= 3.5 Mean Y2= 2.3 Mean Y3= 1.7 Sum up square of Y1=12.25 Sum up square of Y2= 5.29 Sum up square of Y3= 2.89 n1= 6 N2= 6 N3= 6 Total mean = 7.5 N =18 9. Calculate Mean Square within and Mean Square between (2 pts). 10. What's the F statistic in this data (2 pts)? Make decision if alpha was set up at .05, and please use Appendix E (Page 381) to discuss your decision making (2 pts).12. From the table that you created in #11, calculate a, b, and write out the regression equation (i.e., prediction equation) (3 pts). 13. Calculate and interpret error type, Ex (3 pts). 9% Willing to Pay Predicted % Willing to Pay (Y- 7) (Y- VP Higher Taxes (Y) Higher Taxes (Y) 22 00 25 91 25 60 26 74 17 00 24 76 13 80 24 02 36 13 29 00 18 70 25 15 38 57 28 56 45 80 31 38 33 50 28 56 24 60 26 51 18 90 25.20 25 30 26 67 24 80 26 55 17 14 24 79 31 32 1 28 05 18 59 25 13 I= 14. Using your answer from #13, calculate the PRE measure, r'. Interpret (2 pts). 15. About what percentage of citizens are willing to pay higher taxes for a country with a GNP per capita of 5.0 (i.e., $5,000)? For a GNP per capita of 35.0 (i.e., $35,000) (2 pts)
Step by Step Solution
There are 3 Steps involved in it

Get step-by-step solutions from verified subject matter experts