

Answered step by step
Verified Expert Solution
Question
1 Approved Answer
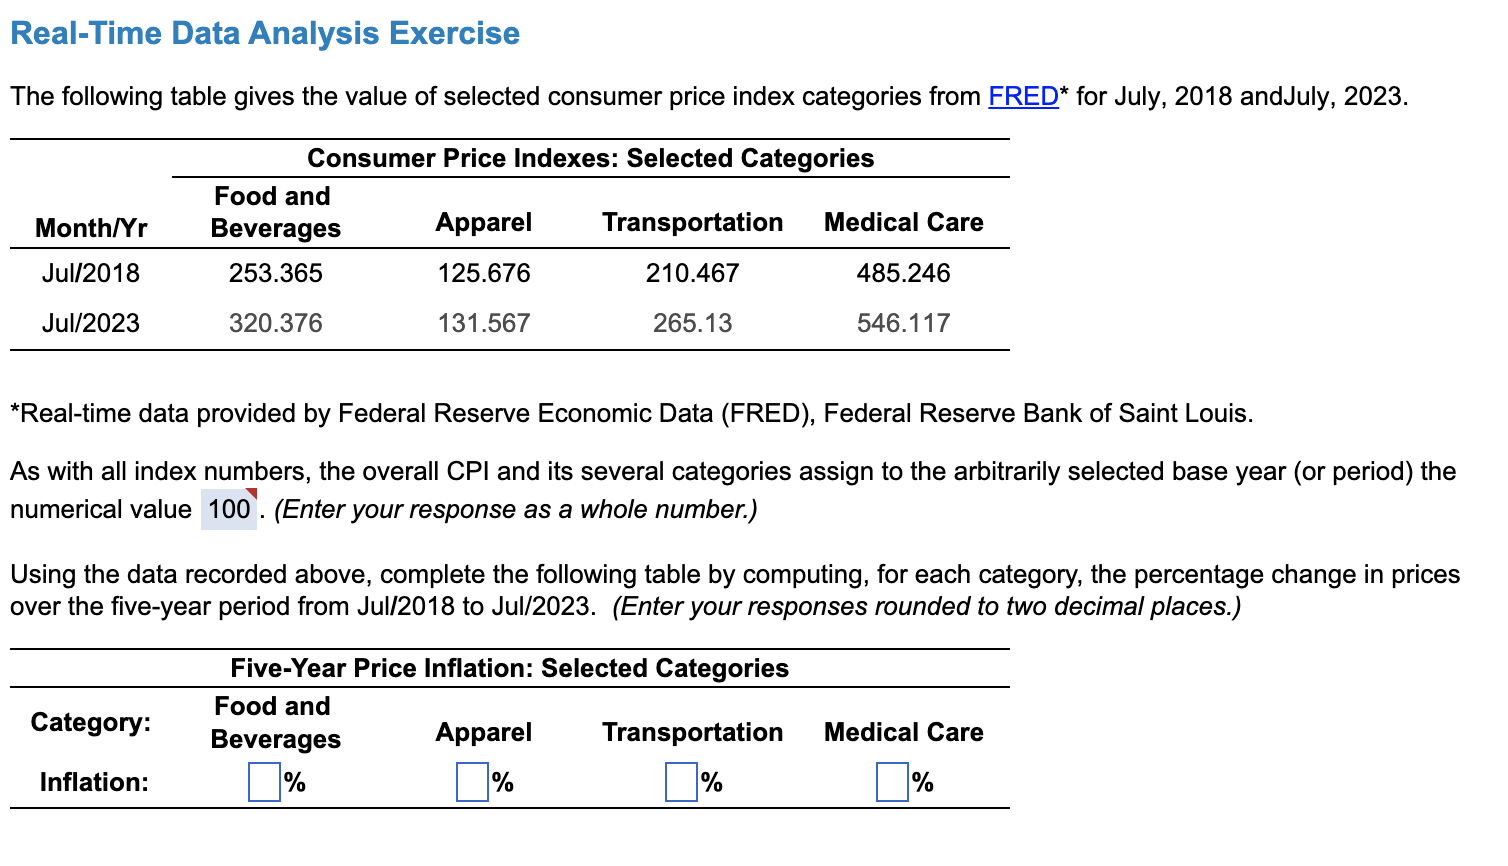
Real-Time Data Analysis Exercise The following table gives the value of selected consumer price index categories from FRED* for July, 2018 andJuly, 2023. Consumer Price

Step by Step Solution
There are 3 Steps involved in it
Step: 1

Get Instant Access to Expert-Tailored Solutions
See step-by-step solutions with expert insights and AI powered tools for academic success
Step: 2

Step: 3
Ace Your Homework with AI
Get the answers you need in no time with our AI-driven, step-by-step assistance
Get Started
New Products Management
Authors: C Merle Crawford
12th Edition
1260512010, 9781260512014